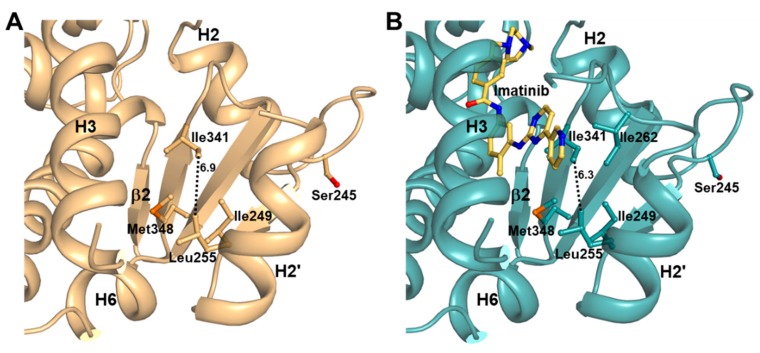
Figure 6.
The hydrophobic interaction network in Arm3 region of PPARγ LBD. (A) The ligand-free PPARγ R288A mutant LBD structure is shown in a ribbon diagram (light orange), and the residues forming the hydrophobic interaction network are represented by stick models. Dashed line represents the distance between Leu255 and Ile341, and the corresponding distances (Å) are labeled. (B) The imatinib-bound PPARγ R288A mutant LBD structure is shown in a ribbon diagram (light teal). Imatinib is shown in a yellow orange stick model. All other marks are shown similarly to (A).

