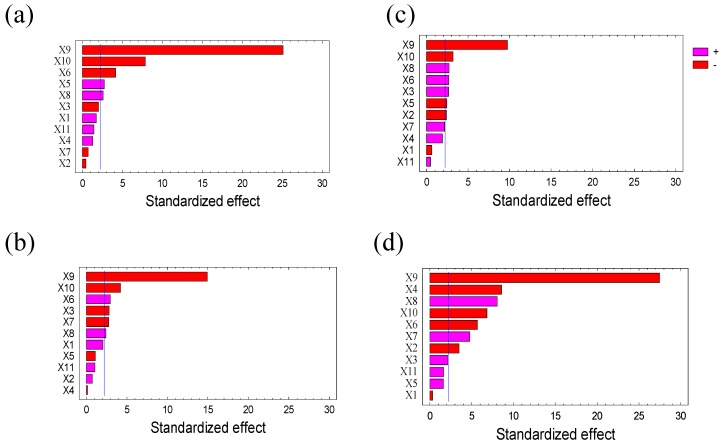
Figure 1.
Standardized Pareto graph showing effect of the type of solvent, X1; the composition of solvents mixture, X2; the ratio of sample/solvent, X3; the concentration of Urea, X4; the extraction temperature, X5; the extraction time, X6; stirring speed, X7; pH, X8; type of salt, X9; concentration of salt, X10; and centrifugation speed, X11 on: (a,b) concentration of protein and (c,d) inhibition of amylase activity for Julius and Ponticus, respectively. The blue vertical line indicates the limit of the standardized effect whose values are significantly different from zero at the 95.0% confidence level. The pink color shows that the parameter has a positive effect and the red color a negative effect on the experimental response.

