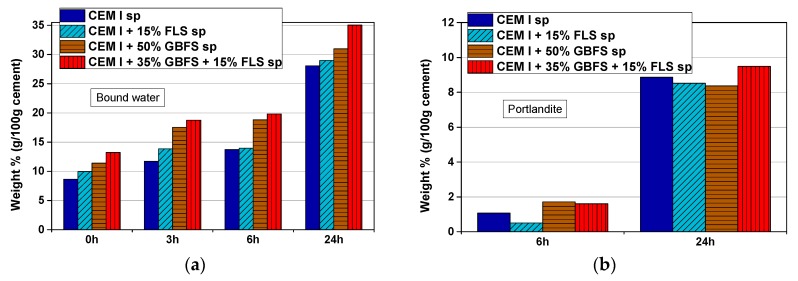
Figure 10.
(a) Bound water after zero, 3, 6, and 24 h in samples from mixes two, four, five, and seven from Table 3 and Table 4 (CEM I + FLS + GBFS sprayed samples), and (b) portlandite content in the samples after 6 and 24 h, both expressed in wt.% (g/100 g cement), as deduced from TG measurements.

