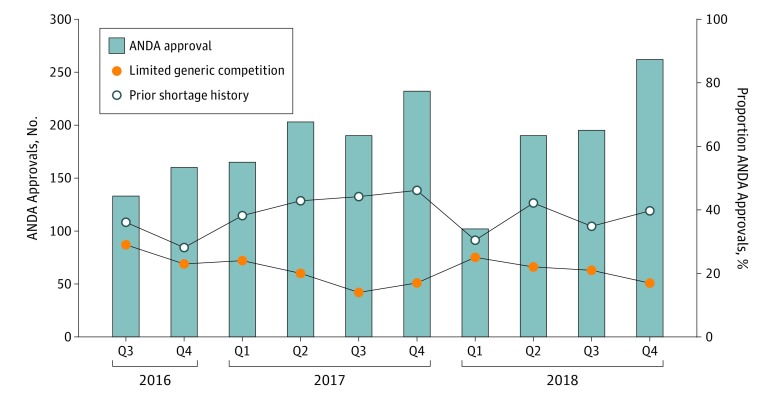
Figure. Generic Drug Approvals by the US Food and Drug Administration Overall and for Drugs With Limited Competition and Prior Shortages by Quarter (Q) From 2016 to 2018.
Bars are graphed using the scale on the y-axis to the left; lines are graphed using the scale on the y-axis to the right. ANDA indicates abbreviated new drug applications.

