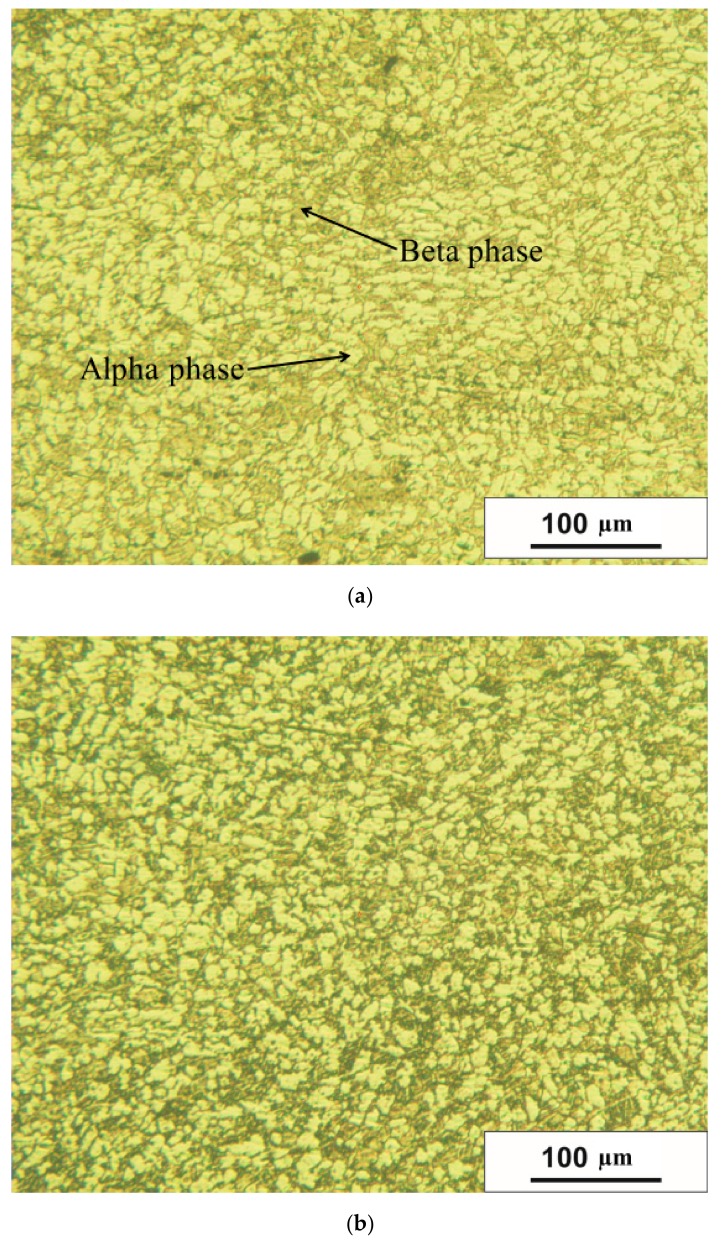
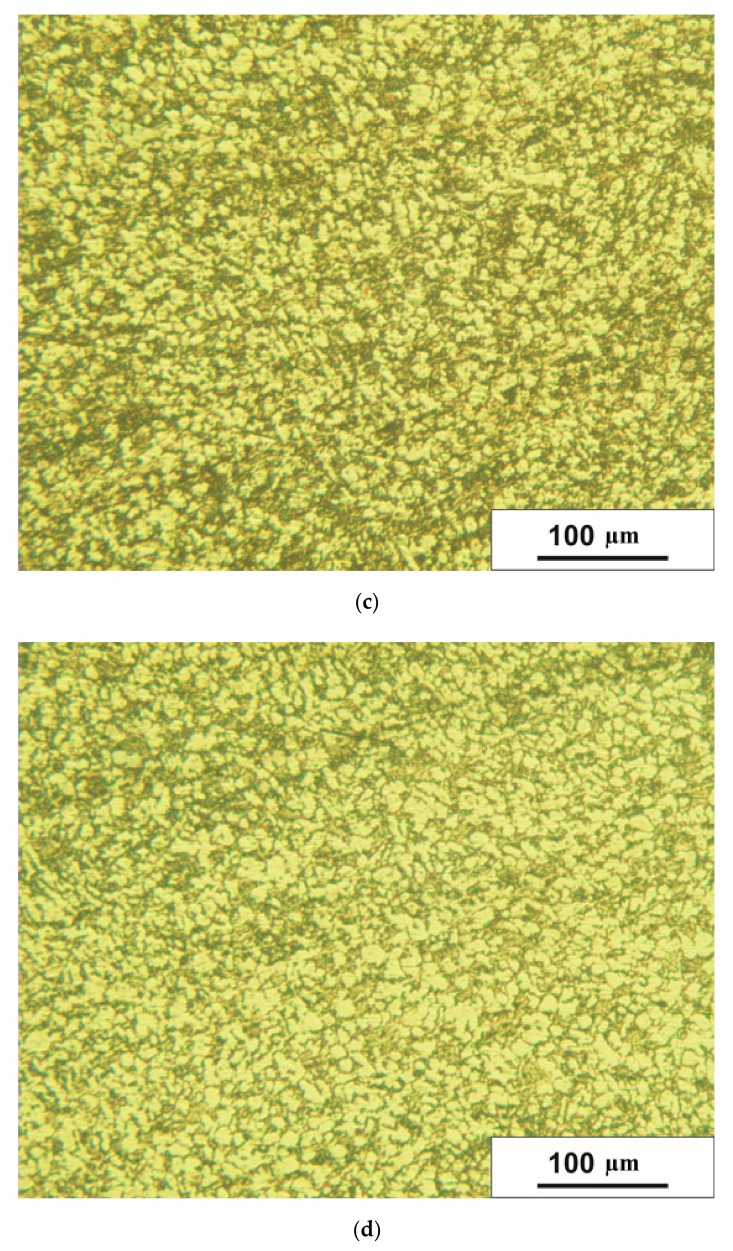
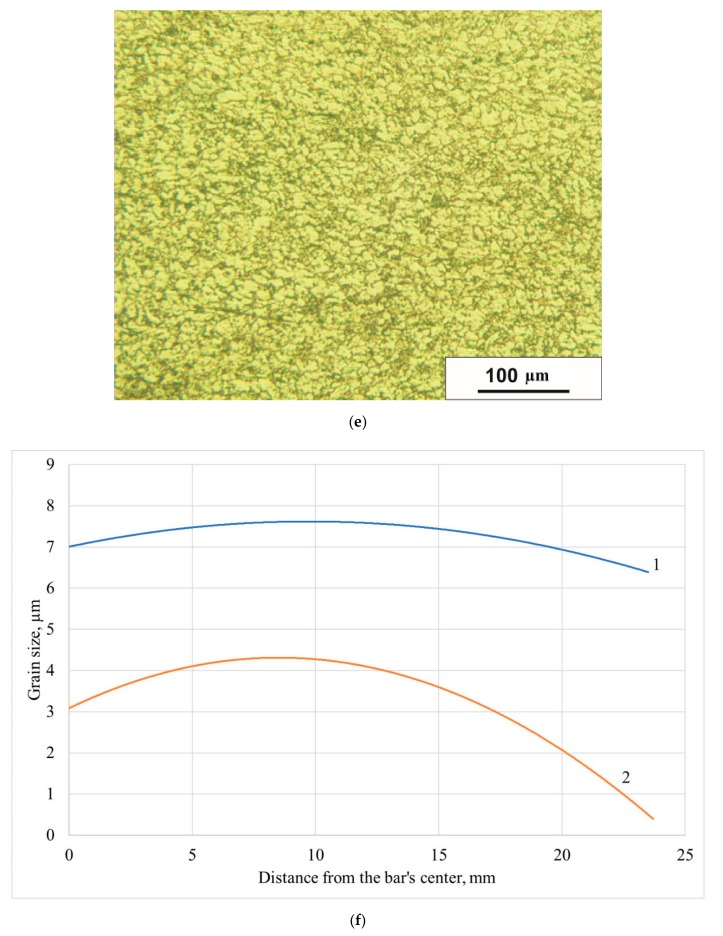
Figure 4.
The bar microstructure in the cross section after RSR: (a) is the center, (b) is 5 mm from the center, (c) is 10 mm from the center, (d) is 15 mm from the center, (e) is 20 mm from the center, (f) is the grain size change along the bar’s radius, 1 is the alpha phase (bright), 2 is the beta phase (dark).


