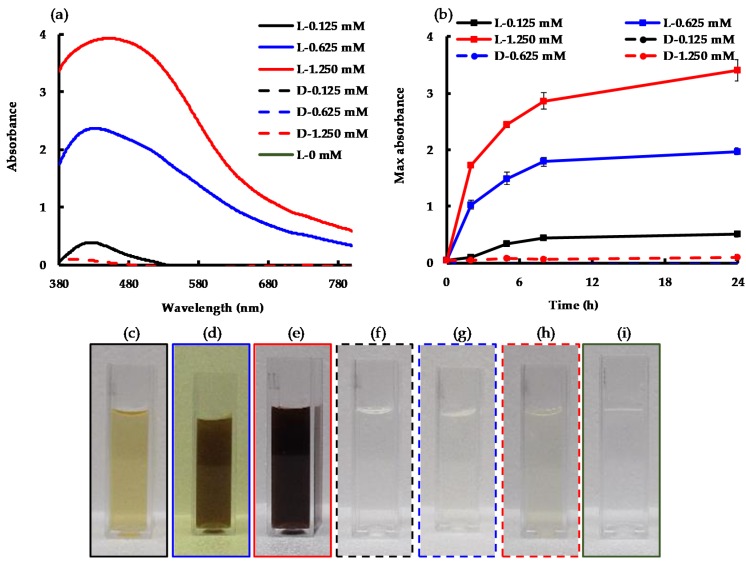
Figure 2.
(a) Spectrophotometric measurements at 24 h; (b) Change of silver nanoparticle (AgNP) surface plasmon resonance (SPR) intensity vs. time over 24 h; (c–i) Reaction mixture in 1 cm pathlength cuvettes after 24 h of synthesis (c) L-0.125 mM; (d) L-0.625 mM; (e) L-1.250 mM; (f) D-0.125 mM (g) D-0.625 mM; (h) D-1.250 mM; (i) L-0 mM. “L-” indicates “in the light”; “D-” indicates “in the dark”; the values following are the concentrations of Ag+ in the synthesis reaction. The border of each photo (c–i) matches the series lines in (a,b).

