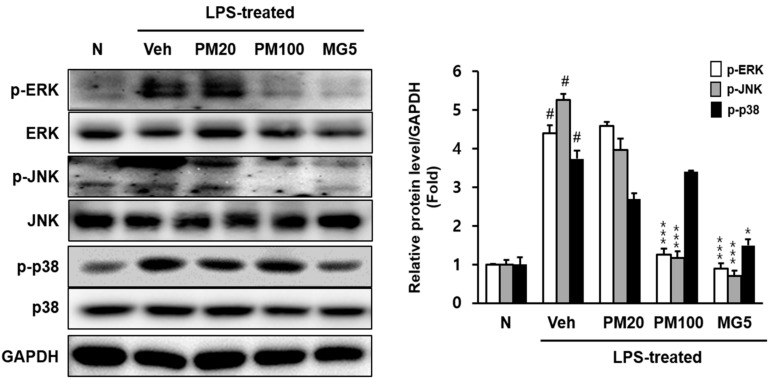
Figure 4.
Total and phosphorylated p-ERK, p-JNK, and p-p38 protein levels in the kidney. N, normal mice; Veh, vehicle-administered and LPS-treated mice; PM20, P. suffruticosa 20 mg/kg body weight-administered and LPS-treated mice; PM100, P. suffruticosa 100 mg/kg body weight-administered and LPS-treated mice; and MG5, methyl gallate 5 mg/kg body weight-administered and LPS-treated mice. The protein levels of p-ERK, p-JNK, and p-p38 were quantified using CS analyzer software. Respective total-form proteins were used as loading control. A representation of three experiments that yielded similar results. One-factor ANOVA: # p < 0.05 versus normal mice; * p < 0.05 and *** p < 0.001 versus veh (vehicle-administered and LPS-treated mice). Bars indicate standard errors of means (S.E.M.).

