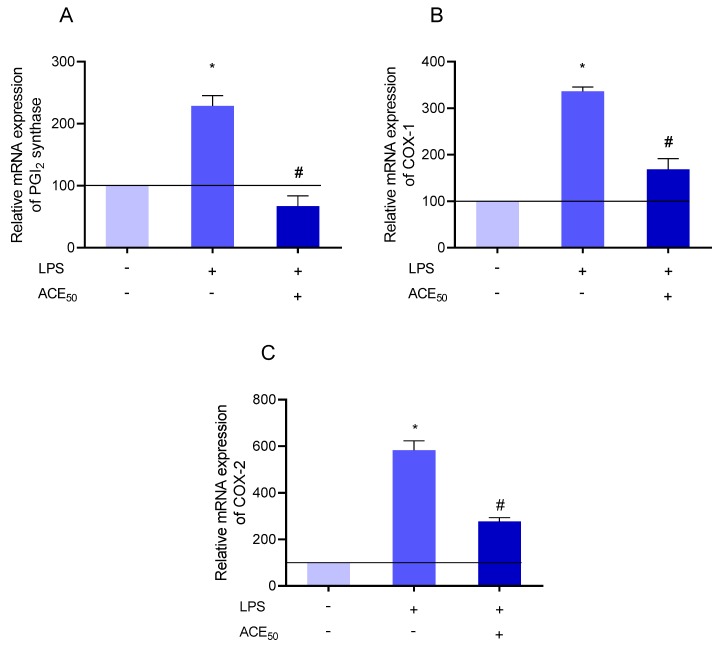
Figure 10.
(A) The level of prostacyclin (PGI2) synthase mRNA increased significantly compared to the control after LPS-treatment indicated by *. # indicates the significant changes in PGI2 synthase mRNA in LPS-induced inflammation and ACE50 treatment compared to the level of PGI2 synthase mRNA in LPS-induced inflammation without ACE50. (B) The level of cyclooxygenase-1 (COX-1) mRNA increased significantly compared to the control after LPS-treatment indicated by *. # indicates the significant changes in COX-1 mRNA in LPS-induced inflammation and ACE50 treatment compared to the level of COX-1 mRNA in LPS-induced inflammation without ACE50. (C) The level of COX-2 mRNA increased significantly compared to the control after LPS-treatment indicated by *. # indicates the significant changes in COX-2 mRNA in LPS-induced inflammation and ACE50 treatment compared to the level of COX-2 mRNA in LPS-induced inflammation without ACE50. Results are expressed in the percentage of the control (100% is represented by the solid lines). Data are expressed as the mean ± SEM of four individual experiments. ACE50, 50 μg/mL anthocyanin extract.

