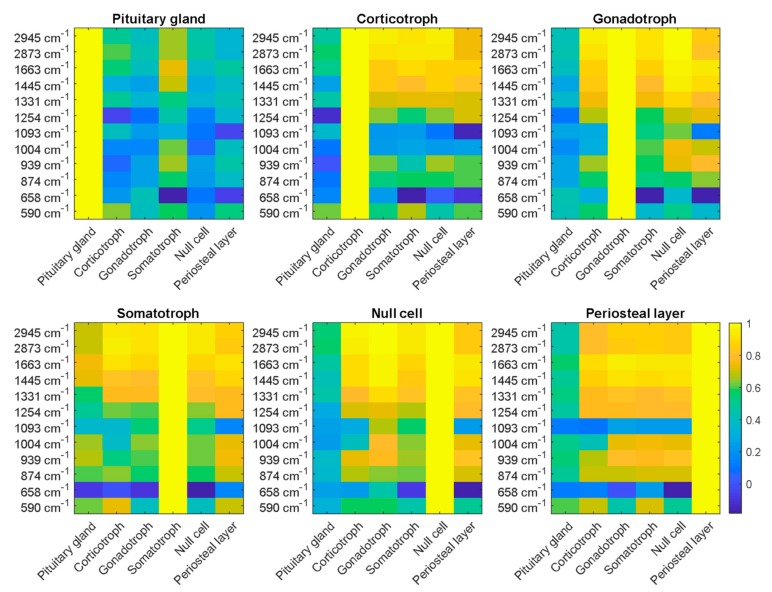
Figure 7.
Correlation coefficients were calculated between LSRM images of pituitary gland, periosteal layer and adenoma subtypes (corticotroph, gonadotroph, somatotroph and null cell) at representative wavenumbers. The significance of these peaks was determined via the results of the PCA. Pituitary gland could be clearly discriminated based on the correlation coefficients between the different classes. As indicated on the color bar on the right, the correlation coefficient ranges from 0 to 1, where 1 quantifies high correlation between the investigated classes.

