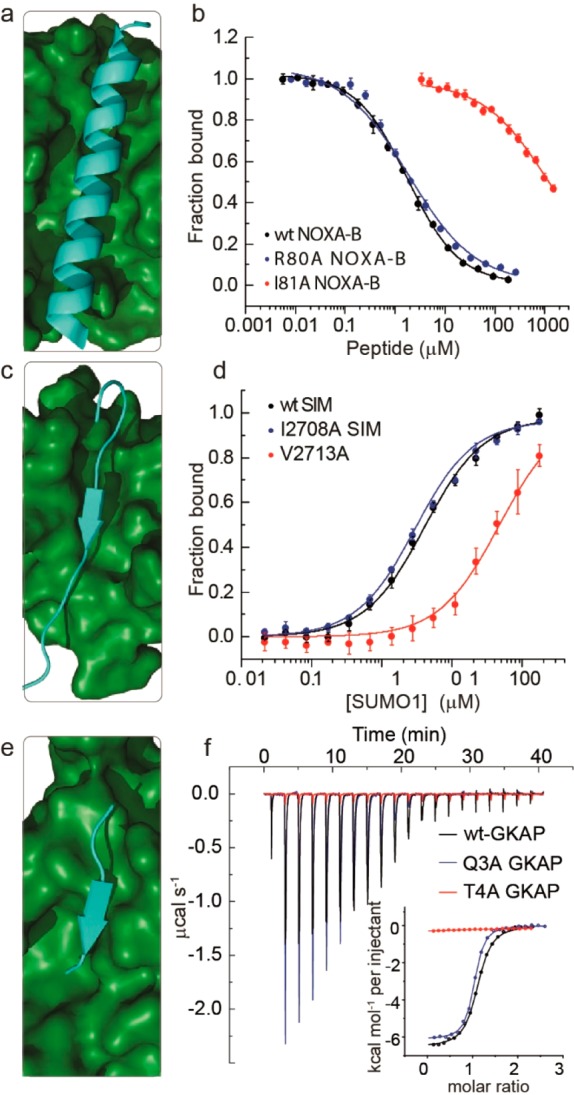
Figure 3.

Experimental alanine scanning results for PPIs (amino acid numbering taken from PDB ID): (a) NMR structure for NOXA-B/MCL-1 (PDB ID 2JM6, model 1)), (b) representative competition fluorescence anisotropy inhibition curves for inhibition of the FITC–Ahx–NOXA-B/MCL-1 (50 mM Tris, 150 mM NaCl, 0.01% Triton-X, pH 7.4. using FITC–Ahx–NOXA-B as a tracer at 25 nM concentration and MCL-1 at 200 nM concentration) interaction using variant NOXA-B peptides, (c) NMR structure for SIMS/SUMO (PDB ID 2LAS, model 1), (d) representative fluorescence anisotropy titration curves for interaction of FAM labeled variant SIMS peptides with SUMO (20 mM Tris, 150 mM NaCl, 0.01% Triton-X, pH 7.4, using 50 nM FAM–PEG–SIM tracer), (e) crystal structure for GKAP/SHANK-PDZ (PDB ID 1Q3P), (f) representative isothermal titration calorimetry curves for interaction of acetylated GKAP variant peptides with SHANK-PDZ (20 mM Tris, 150 mM NaCl, pH 7.5, at 25 °C, 150 μM SHANK-PDZ).
