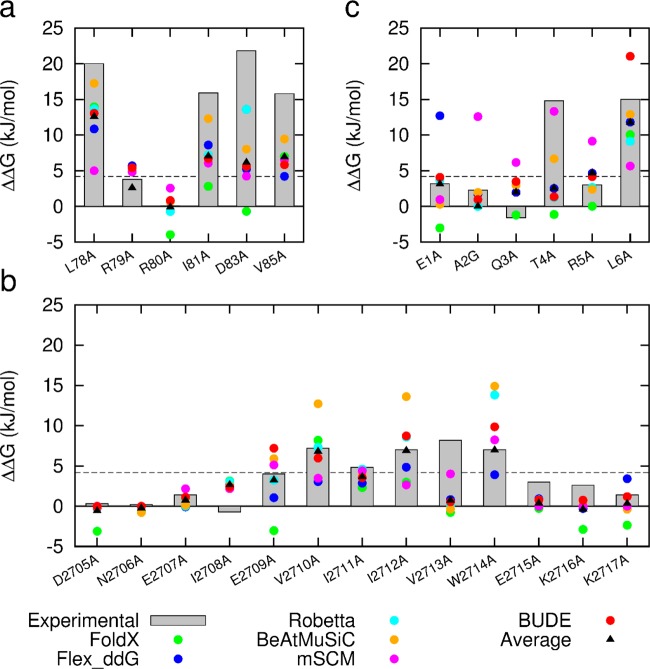
Figure 5.
Comparison of predictive and experimental ΔΔG values (bars represent experimental data for each target): (a) NOXA-B/MCL-1 (PDB model 1); (b) SIMS/SUMO (PDB model 1); (c) GKAP/SHANK-PDZ (chains A and C). Two data points for FoldX are missing from the plot since they are less than −5.0 kJ/mol (R79A and W2714A).

