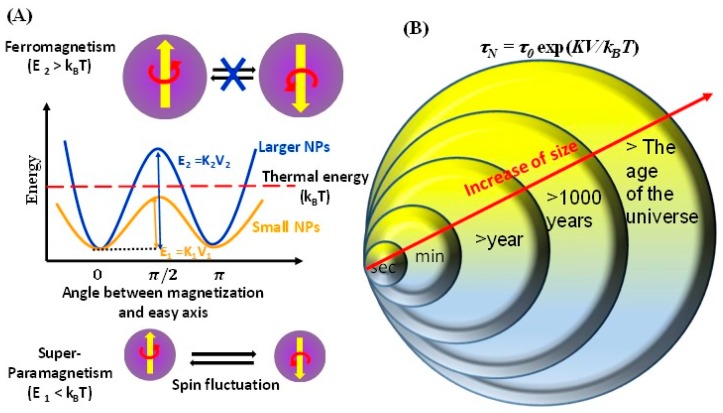
Figure 3.
(A) The top of (A) depicts the reversal of magnetization in ferromagnetic particles. The energy diagram below illustrates the difference in energy barrier for a large particle behaving as ferromagnet and a small particle behaving as superparamagnet. The bottom of (A) depicts the relaxation process in superparamagnetic particles. (B) A typical correlation between the Néel relaxation time and the MNPs diameters. MNPs with extremely high τN are promising for recording media applications.

