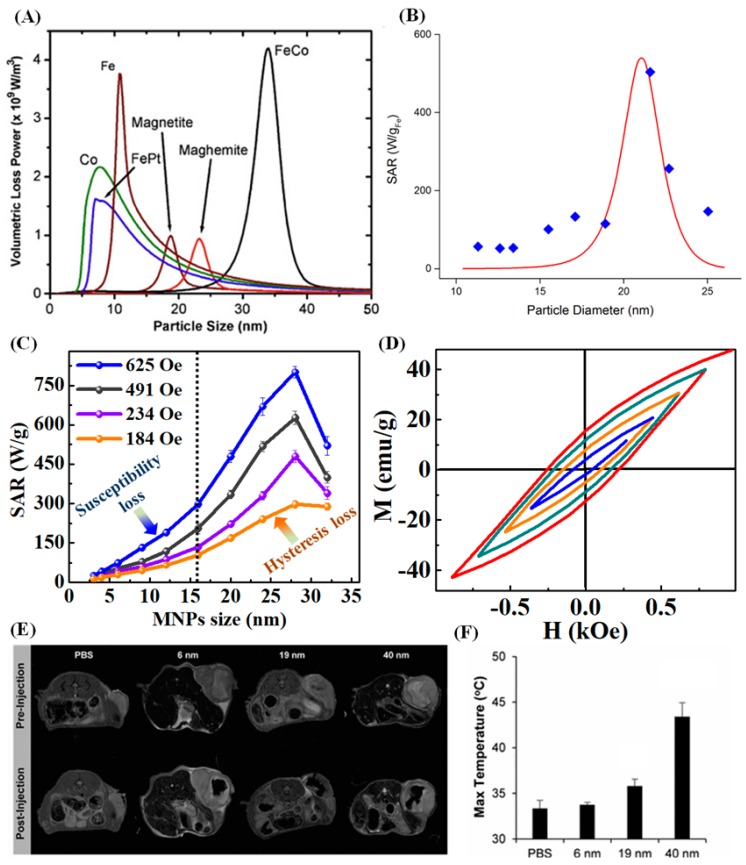
Figure 8.
(A) Depicts volumetric loss power versus particle size for various MNPs dispersed in water at 10% particle concentration in ACMF (f = 300 kHz, Hac = 50 mT) [80]. (B) The theoretical (red) and experimental (blue) SAR values of Fe3O4 nanoparticles with different diameters [81]. (C) Depicts the variation of the SAR values as a function of MNP size at different amplitudes for the ACMF field (184–625 Oe) [71]. (D) Shows the room temperature minor M(H) loops of 28 nm MNPs at various magnetic fields: 300 (blue), 500 (orange), 700 (green) and 900 Oe (red) [71]. (E) MRI images of the cross section of the mouse bodies before and after infusion of 6, 19 and 40 nm Fe3O4 nanoparticles dispersion and (F) Maximum temperature reached during 1 h of heating [76].

