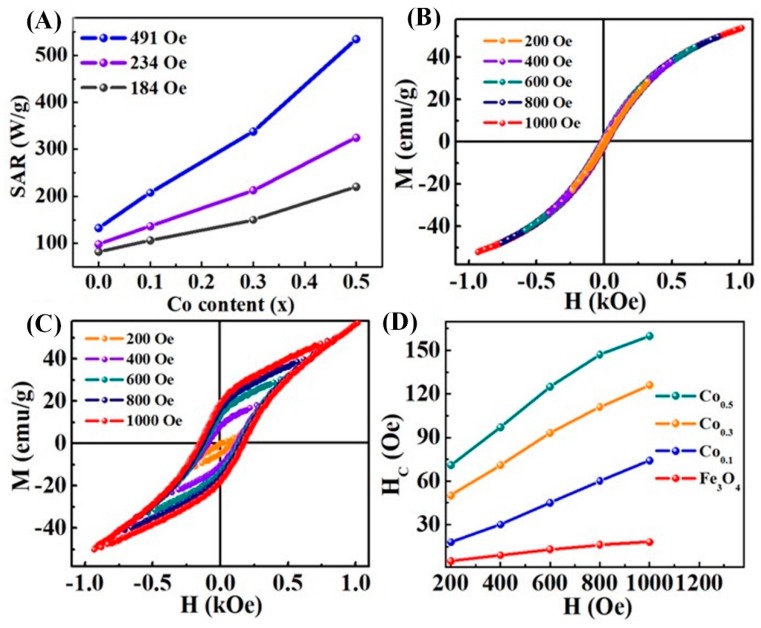
Figure 10.
(A) Shows a plot of SAR as a function of Co content in Fe3O4 NPs across several values of applied ACMF field (184–491 Oe). (B,C) Show the room temperature minor M(H) loops at maximum magnetic field of 200, 400, 600, 800 and 1000 Oe for Fe3O4 and Co0.5Fe2.5O4 nanoparticles, respectively. (D) Shows the coercive field as a function of Co content in Fe3O4 NPs at various applied magnetic fields [100].

