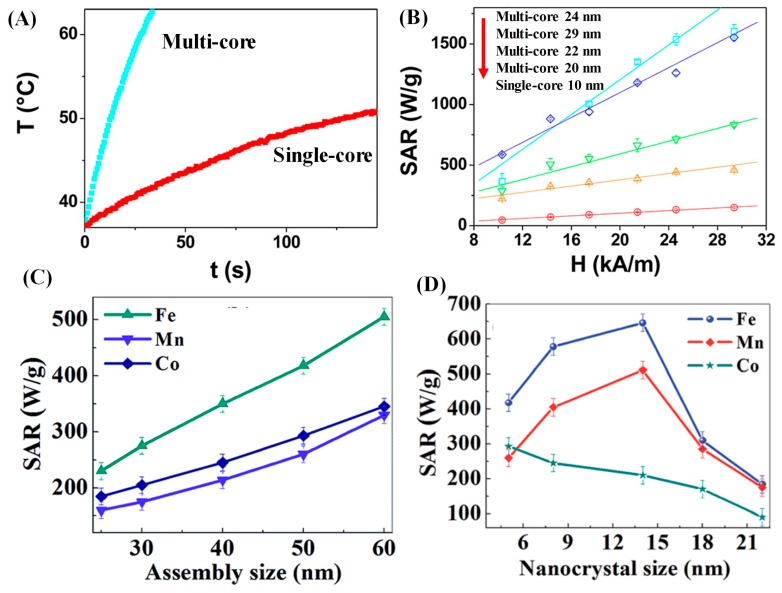
Figure 16.
A comprehensive demonstration of the optimization of hyperthermia heating efficiency of MFe2O4 MNPAs by controlling size, composition, and magnetic coupling among the nanocrystals within the nanoassembly. (A) Heating curves for multi-core and single-core Fe3O4 nanostructures are recorded under an ACMF of amplitude 29 kA/m and at frequency 520 kHz [25]. (B) SAR values as a function of the ACMF amplitude at frequency f = 520 kHz for multi-core 24 nm (cyan), multi-core 29 nm (blue), multi-core 22 nm (green), multi-core 20 nm (orange), and single-core 10 nm (red) [25]. (C) The SAR as a function of nanoassembly size of MFe2O4 (M = Mn, Fe and Co) with nanocrystal size 4 nm [70]. (D) The SAR as a function of nanoassembly size of MFe2O4 with variation of nanocrystal size from 6 to 21 nm [70].

