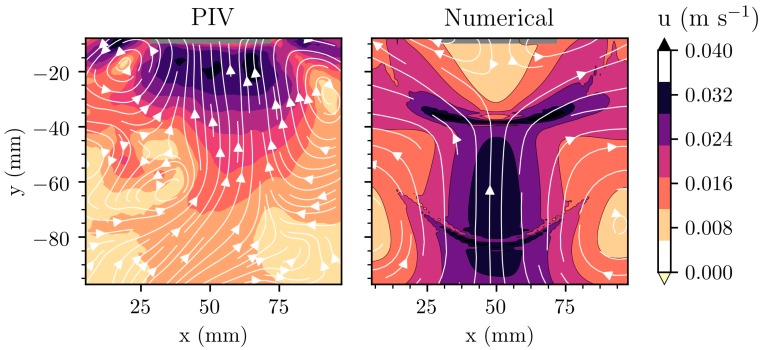
Figure 3.
Comparison between measured velocities using particle image velocimetry (PIV) [63] in water and predictions of acoustic streaming using the numerical model described in [35]. The velocities are in m s−1. The grey bar at the top of each contour represents the vibrating surface. The dataset used to reproduce these results is available elsewhere [69].

