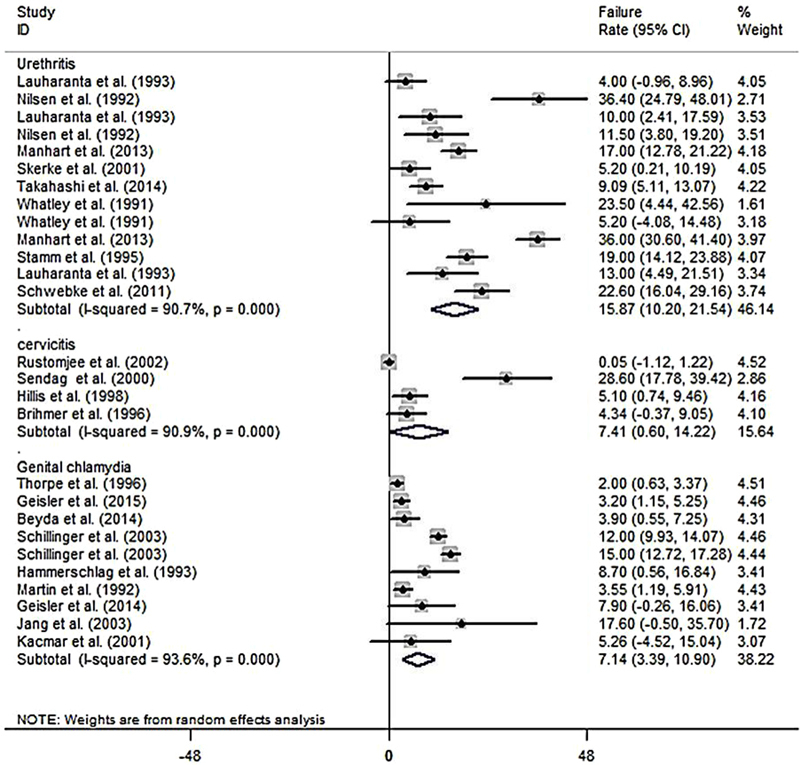
Figure 4.

A Pooled estimate of failure rate difference (failure rate in intervention - failure rate in control) based on the random effects model in total and in different diseases. The midpoint of each line segment shows the failure rate difference, the length of the line segment indicates the 95% confidence interval in each study, and the diamond mark illustrates the pooled estimate.
