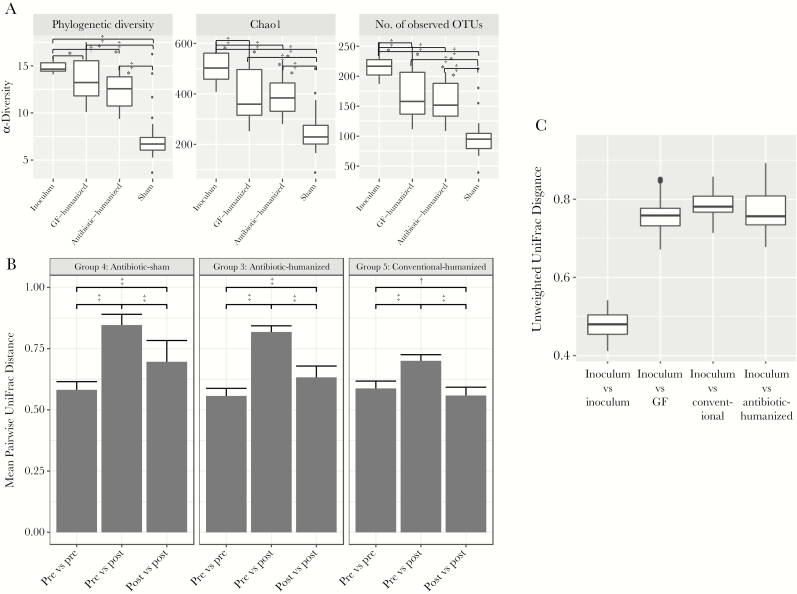
Figure 4.
Microbial community ecology. A, α-Diversity in the gavage inoculum and in the treatment groups. The α-diversity metrics are represented using phylogenetic diversity (left), Chao1 index (middle), or number of observed operational taxonomical units (OTUs) (right). All comparisons were significant, except the comparison between germ-free (GF)–humanized and antibiotic-humanized groups using all 3 α-diversity measurements, based on false discovery rate–adjusted Wilcoxon rank sum tests. *P < .05; †P < .01; ‡P < .001 (for group comparisons). B, Analysis of β-diversity in samples before (pre) and after (post) gavage. Results show mean pairwise unweighted UniFrac distances with intragroup and intergroup (pre and post) comparisons. Groups were compared using Wilcoxon rank sum tests, corrected for multiple comparisons. *P < .01; †P < .001. C, β-Diversity (community structure) of samples from the treatment groups in relation to the gavage inoculum. Mean pairwise unweighted UniFrac distances are shown in relation to the intragroup variation for the inoculum. All comparisons were significant by false discovery rate–adjusted Wilcoxon rank sum tests (P < .001).

