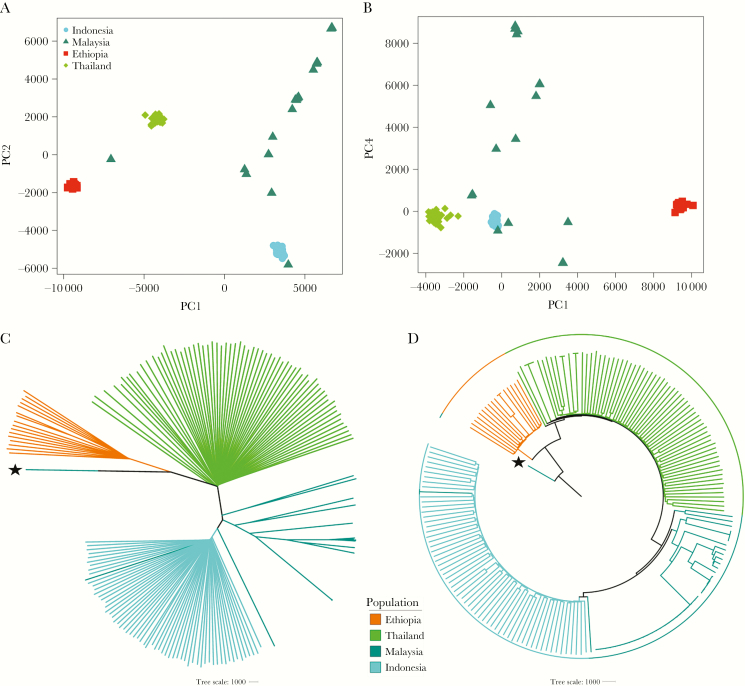
Figure 2.
Plasmodium vivax population structure and relatedness in Ethiopia relative to the Asian populations. All plots were generated using genomic data derived from 191 high-quality, monoclonal (within-sample F statistic [FWS] > 0.95) samples. A and B, Principal coordinates analysis plots illustrating the genetic differentiation within and between populations, respectively. Principal components (PC) 1–4 reflect 16.8%, 10.8%, 9%, and 2.9% of the variance, respectively. C and D, Unrooted and rooted neighbor-joining trees, respectively. The rooted tree is presented to illustrate similarity between infections in a given population rather than evolutionary patterns. The PY0120-C isolate from Malaysia, labeled with a star, was used as the ancestral sample; this sample is a suspected imported case that has been shown to have close identity with infections from India and Bangladesh (data not presented).

