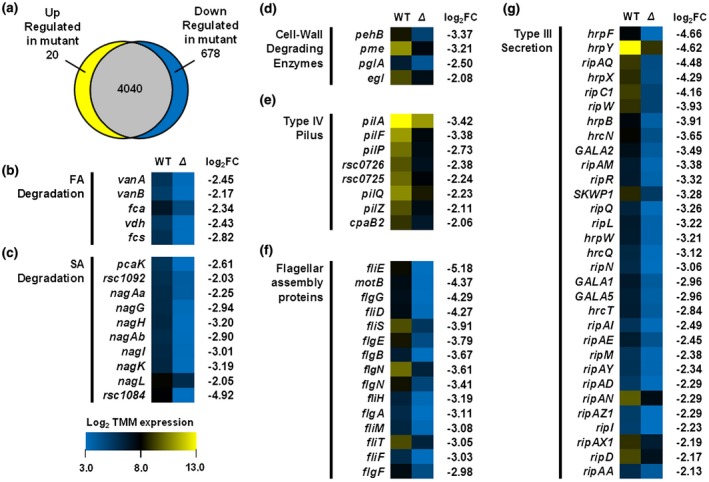
Figure 7.

Gene expression in the Ralstonia solancearum prhP mutant with RNA‐seq. Briefly, total RNAs were isolated from three biological replicates according to the TRIzol reagent method (Life Technologies, Carlsbad, CA, USA) and subjected to RNA‐seq. Mean values of three biological replicates were averaged and subjected to statistical analysis. (a) A proportional Venn diagram of expression patterns created using BioVenn. Genes with relative expression levels greater than 2‐fold different between the prhP mutant and the wild‐type strain and adjusted P values of <0.05 were classified as differentially expressed genes (DEGs). (b)–(g) Heat maps show absolute expression of DEGs in different functional categories of (b) ferulic acid (FA) degradation, (c) salicylic acid (SA) degradation, (d) cell wall‐degrading enzymes, (e) type IV pilus, (f) flagellar assembly proteins and (g) T3SS and T3Es. Heat maps indicating low absolute expression (blue; 3.0) to high absolute expression (yellow; 13.0) are shown to the right of gene names. The fold change (prhP mutant versus RK5050) is shown to the right of each heat map.
