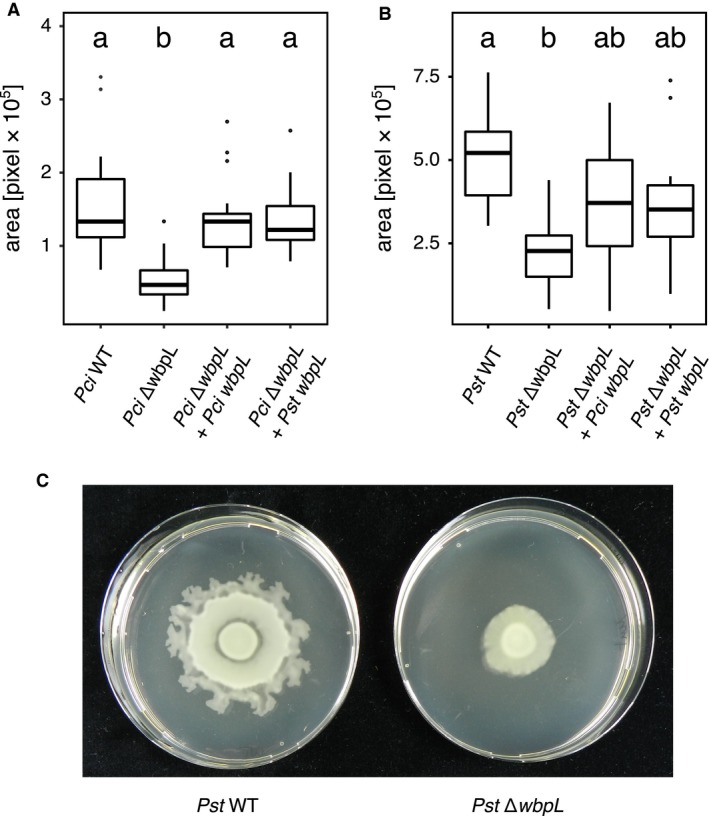
Figure 6.

Comparison of swarming motility of Pseudomonas syringae pv. tomato DC3000 (Pst WT, A, n = 11, exemplary images in C) and Pseudomonas cichorii ATCC10857/DSM50259 (Pci WT, B, n = 16) with the respective ∆wbpL::GmR (∆wbpL) and Pci WbpL (Pci‐wbpL) or Pst WbpL (Pst‐wbpL) expressing complementation strains. Data from three independent experiments were pooled. Letters indicate statistical difference (P < 0.05) calculated by a Kruskal–Wallis rank sum test and post hoc pairwise comparisons using the Nemenyi‐test with chi‐squared approximation for independent samples.
