
Figure 5.
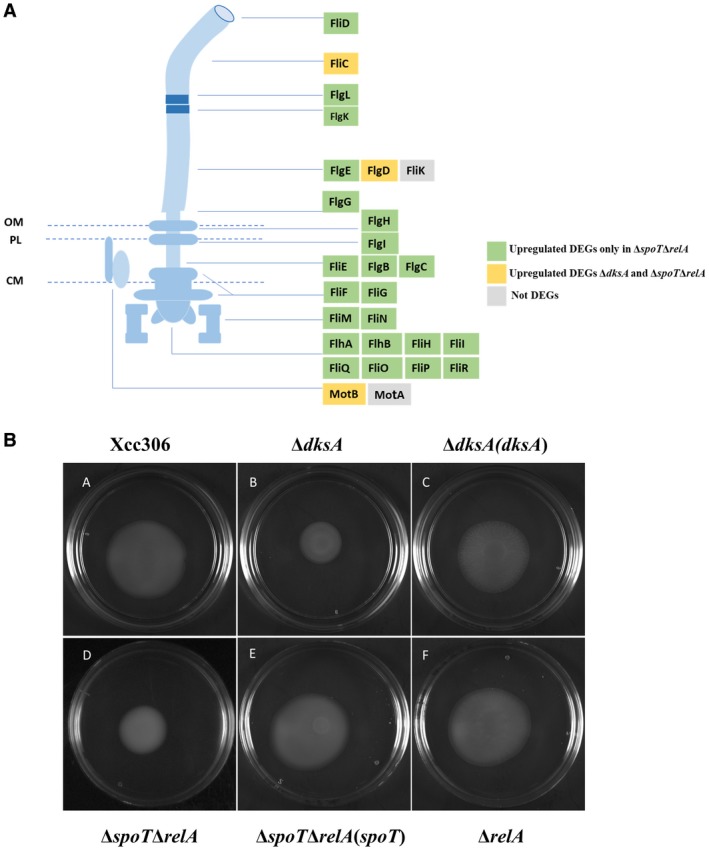
Negative regulation of flagellar assembly genes by (p)ppGpp. (A) Schematic diagram of bacterial flagellum. Gene expression changes in the ΔdksA and ΔspoTΔrelA strains compared to wild‐type Xanthomonas citri subsp. citri (Xcc306) are indicated by different colours. OM, outer membrane; PL, peptidoglycan layer; CM, cytoplasmic membrane. (B) Motility test of bacteria on 0.25% nutrient agar plate. Plates were incubated for 48 h before photographing. The experiment was repeated independently three times with similar results.