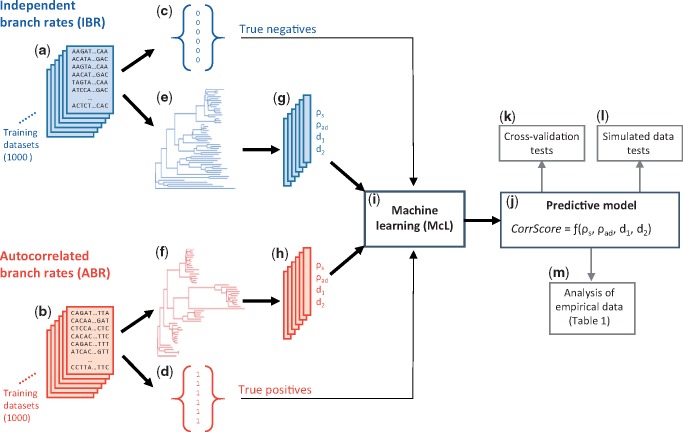
Fig. 1.
A flowchart showing an overview of the McL approach applied to develop the predictive model (CorrTest). We generated (a) 1,000 training data sets that were simulated using IBR models and (b) 1,000 training data sets that were simulated using ABR models. The numerical state (c) for all IBR data sets was 0 and (d) for all ABR data sets was 1. For each data set, we estimated a molecular phylogeny with branch lengths (e and f) and computed ρs, ρad, d1, and d2 (g and h) that served as features during the supervised McL. (i) Supervised McL was used to develop a predictive relationship between the input features and numerical states. (j) The predictive model produces a CorrScore for an input phylogeny with branch lengths. The predictive model was (k) validated with 10- and 2-fold cross-validation tests, (l) tested using external simulated data, and then (m) applied to empirical data to examine the prevalence of rate autocorrelation in the tree of life.

