Fig. 3.
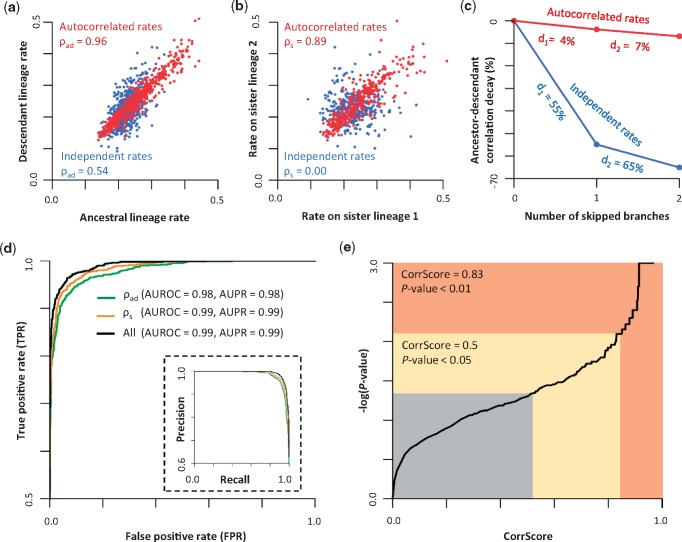
The relationship of (a) ancestral and direct descendant lineage rates and (b) sister lineage rates when the simulated evolutionary rates were autocorrelated with each other (red) or varied independently (blue). The correlation coefficients are shown. (c) The decay of correlation between ancestral and descendant lineages when we skip one intervening branch (d1) and when we skip two intervening branches (d2). Percent decay values are shown. (d) ROC and PR curves (inset) of CorrTest for detecting branch rate model by using only the feature of ancestor–descendant lineage rates correlation (ρad, green), only the feature of sister lineage rates correlation (ρs, orange), and all four features (all, black). The area under the curve is provided. (e) The relationship between the CorrScore produced by the McL model and the P value. IBR model can be rejected when the CorrScore is >0.83 at a significant level of P < 0.01, or when the CorrScore is >0.5 at P < 0.05.

