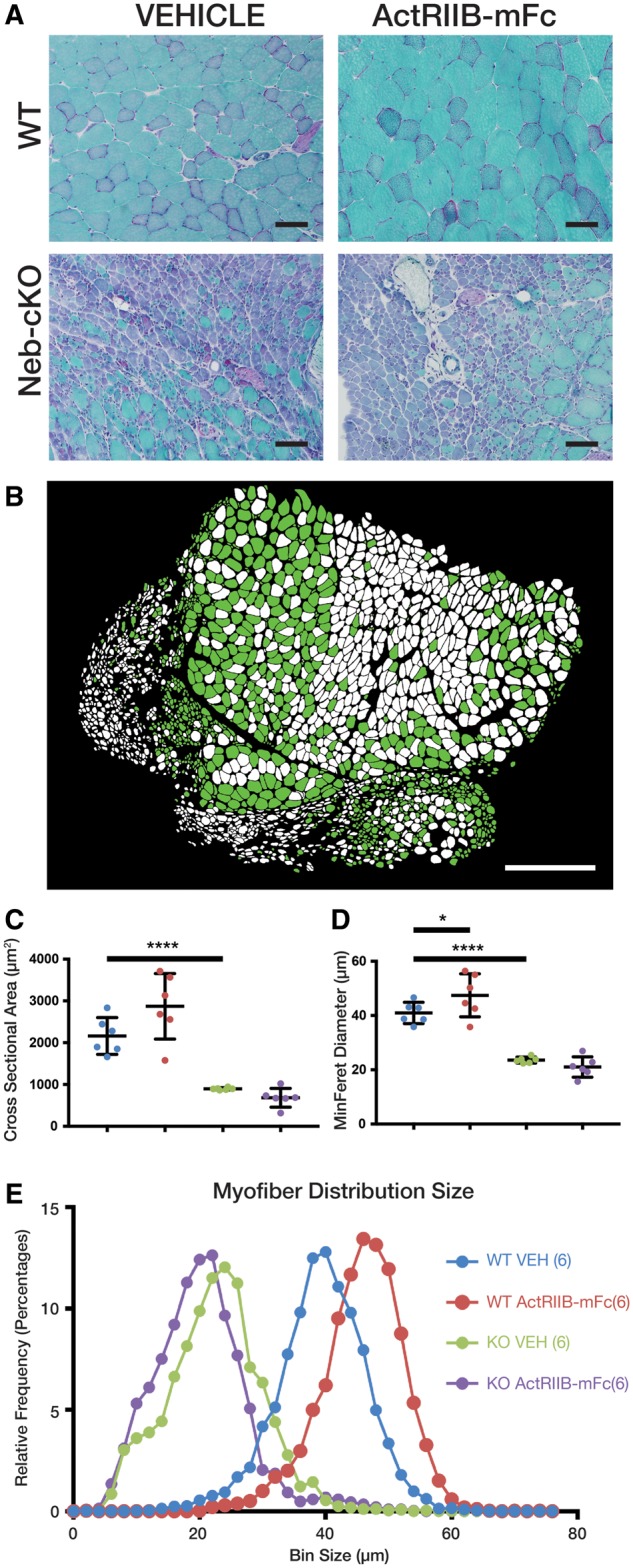
FIGURE 2.

Pathology and myofiber size following ActRIIB-mFc treatment in Neb cKO mice. (A) Representative areas of transversely sectioned quadriceps muscle after sectioning and Gomori trichrome staining, representative of 7–10 animals per group. (B) Representative image of Neb cKO type 2b myosin-positive (glycolytic, green) and type 2b myosin-negative (oxidative, white) populations on a whole slide scan of one quadriceps muscle, using the Cytoinformatics automated quantification algorithm. Tissue from 6 to 7 animals per group was assessed. (C) Quadriceps myofiber cross-sectional area. (D) Quadriceps myofiber min ferret diameter. Bars and asterisk denote significant (*p ≤ 0.05, **p ≤ 0.01, ***p ≤ 0.001, ****p ≤ 0.0001) differences between treatment groups with relevant comparisons. (E) Frequency histogram depicting myofiber size distributions by minFeret diameter, with a rightward shift in curves as consistent with myofiber growth in treated WT mice.
