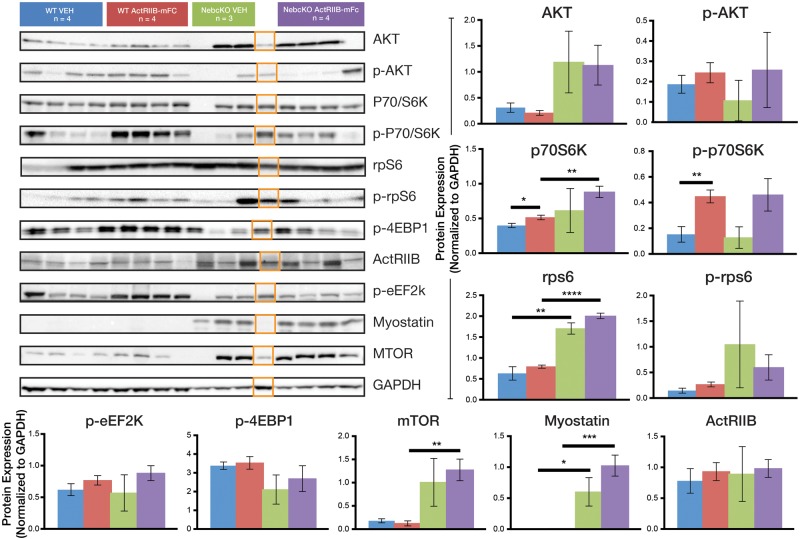
FIGURE 4.
Expression of hypertrophic signaling proteins in Neb cKO mice. (A) Western blot analysis of the quadriceps muscle reveals the similarities and differences between genotypes and treatment groups of 9-week-old mice. (B) A graphical representation of protein expression normalized to GAPDH is shown. Statistical analysis indicates significant relationships most notably between WT vehicle and WT drug for p70/S6K and p-p70/S6K and between WT vehicle and Neb cKO vehicle for rpS6 (*p ≤ 0.05, **p ≤ 0.01, ***p ≤ 0.001). Note that the orange boxes identify a lane that was initially identified as a Neb cKO animal but was later found to be a heterozygote. This lane was not included in the statistical analysis of any group.

