Figure 2.

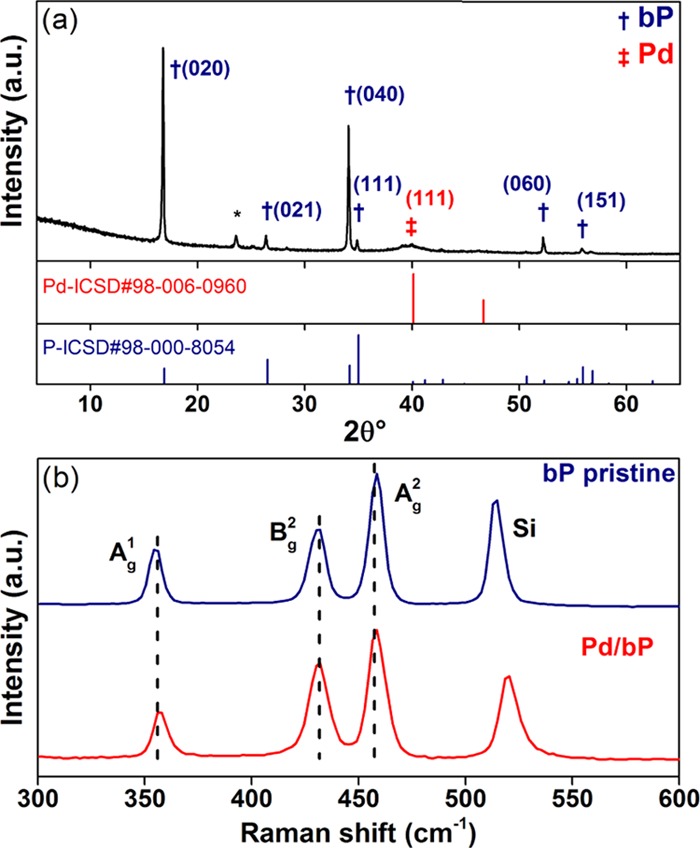
(a) XRD spectrum of Pd/bP. (b) Comparison of Raman spectra collected on the pristine bP (red) and Pd/bP (blue). Each spectrum has been obtained combining the data from 15 different flakes.

(a) XRD spectrum of Pd/bP. (b) Comparison of Raman spectra collected on the pristine bP (red) and Pd/bP (blue). Each spectrum has been obtained combining the data from 15 different flakes.