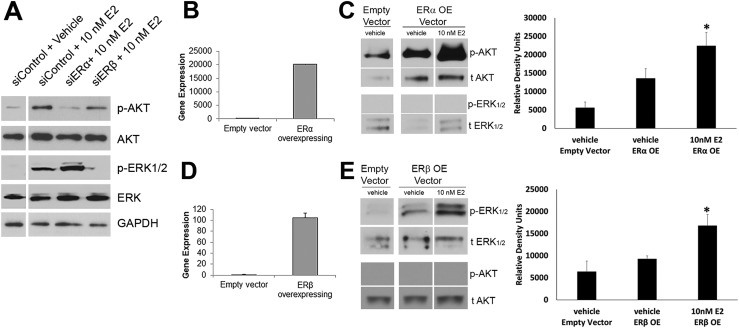
Figure 4.
Receptor subtype–specific signaling cascades are elicited via membrane ERs. (A) Day 5 prostaspheres with ERα or ERβ knocked down by siRNA were exposed to 10 nM E2 for 30 min followed by western blot analysis of AKT and ERK1/2 phosphorylation. Spheroid cells with reduced ERα showed no p-AKT increase upon E2 exposure whereas p-ERK1/2 was robust. In contrast, spheres with reduced ERβ exhibited increased p-AKT with E2 treatment but no phosphorylation of ERK1/2. Images are representative of three to four separate experiments. (B–E) ERα (ERαOE) or ERβ (ERβOE) were overexpressed in WPE-stem cells, and phosphorylation of AKT and ERK1/2 was examined by western blot analysis. (B) qRT-PCR confirms overexpression of ERα in ERαOE cells. (C) Western blots of ERαOE WPE-cells show increased basal p-AKT compared with control vector, which further increased after 30 min of exposure to 10 nM E2. There was no ERK1/2 phosphorylation in ERαOE cells with/without 10 nM E2. Bar graph shows p-AKT in vehicle and with 15 to 30 min of 10 nM E2 (n = 5). *P < 0.05 vs empty vector control. (D) qRT-PCR confirms overexpression of ERβ in ERβOE cells. (E) Western blots of ERβOE WPE cells show increased basal p-ERK1/2 after 60 min of 10 nM E2 exposure but no AKT activation by E2 compared with control. Bar graph shows p-ERK1/2 in vehicles and with 30 to 60 min of 10 nM E2 (n = 3). *P < 0.05 vs empty vector control.

