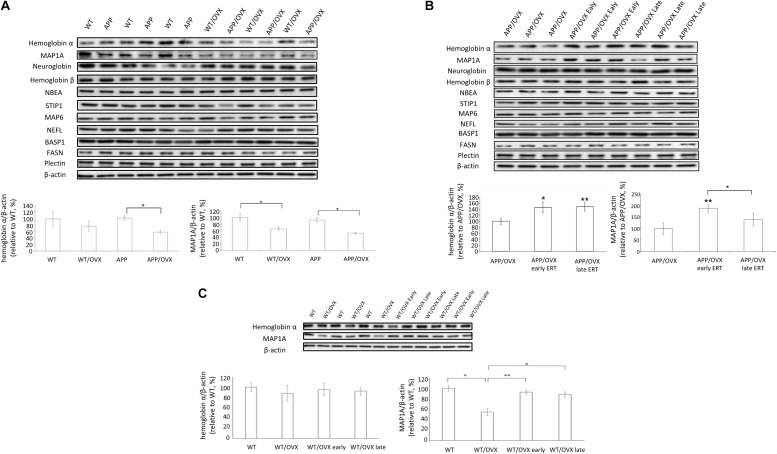
FIGURE 3.
Western blot analysis of proteins identified in proteomic analysis. (A) The levels of hemoglobin α, MAP1A, neuroglobin, hemoglobin β, NBEA, STIP1, MAP6, NEFL, BASP1, FASN, and Plectin were detected in the brain lysates from WT, WT/OVX, APP, and APP/OVX mice, with β-actin as a loading control. (B) The levels of hemoglobin α, MAP1A, neuroglobin, hemoglobin β, NBEA, STIP1, MAP6, NEFL, BASP1, FASN, and Plectin were detected in the brain lysates from APP/OVX, APP/OVX early treatment group and APP/OVX late treatment group, with β-actin as a loading control. (C) The levels of hemoglobin α and MAP1A were detected in the brain lysates from WT, WT/OVX, WT/OVX early treatment group and WT/OVX late treatment group, with β-actin as a loading control. ∗Indicates P < 0.05 compared to APP/OVX or between the designated two groups. ∗∗Means P < 0.01 compared to APP/OVX or designated group as indicated.

