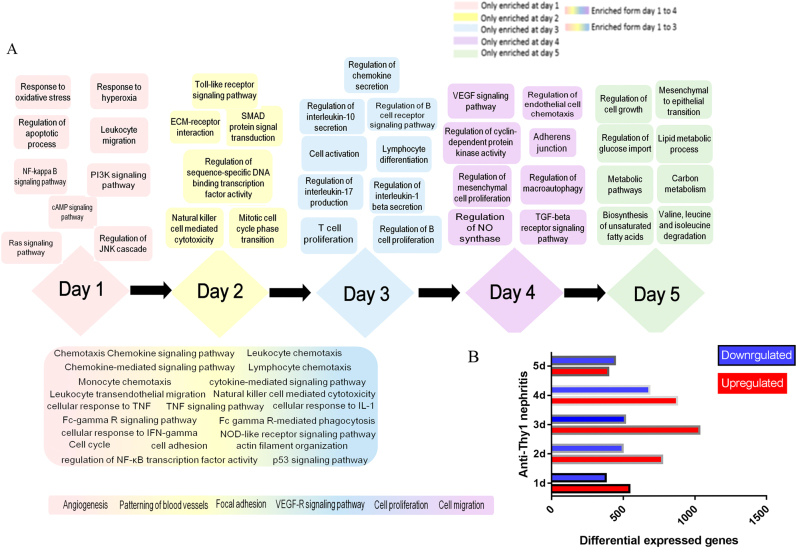
Fig. 3.
Evolution of biological functions during the development of anti-Thy1 nephritis. a Evolution of biological functions during the development of anti-Thy1 nephritis. b Number of differentially expressed genes (DEGs) at each time point. 0 d: Control group, 1–5 d: days after the injection of the anti-Thy1 antibody

