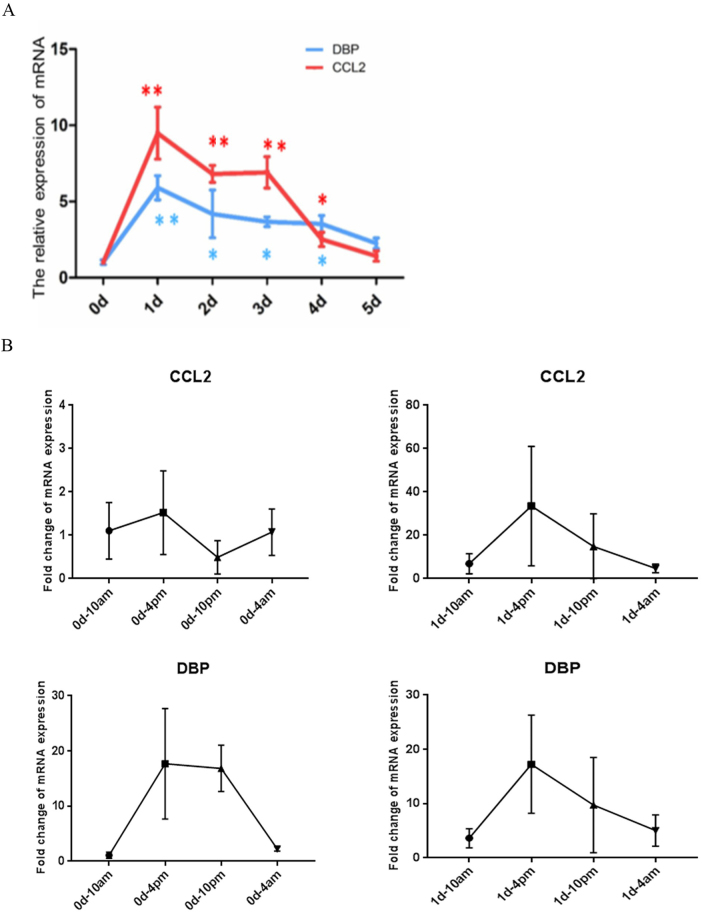
Fig. 5.
The circadian expression of DBP and CCL2 on day 1 in the anti-Thy1 nephritis model. a Trends in CCL2 and DBP expression during the development of anti-Thy1 nephritis, as revealed by quantitative polymerase chain reaction (qPCR). b The circadian expression of CCL2 in the control group and anti-Thy1 nephritis group on day 1, as revealed by qPCR. c The circadian expression of CCL2 in the control group and anti-Thy1 nephritis group on day 1, as revealed by qPCR

