Fig. 2.
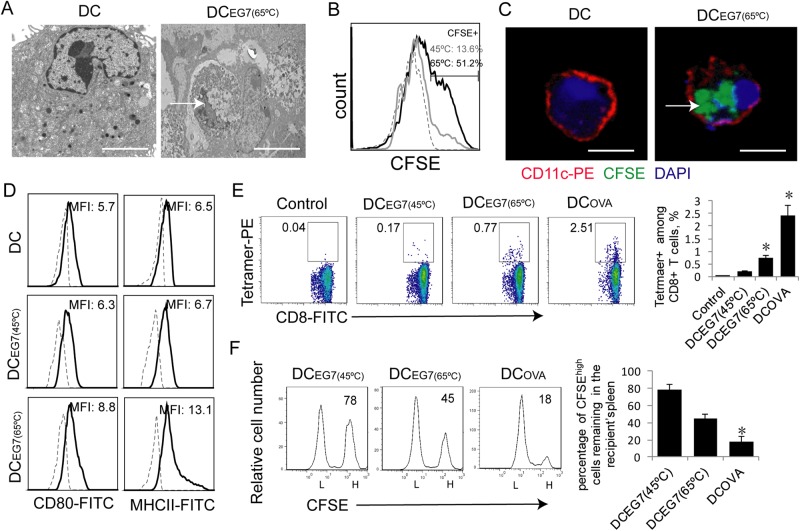
DCs that phagocytose hyperthermia-treated tumor cells stimulate CD8+ CTL responses. a Electron microscopy images of an untreated DC and a DC with a phagocytosed necrotic EG7 tumor cell (arrow) within its cytoplasm. Scale bar = 10 μm. b Flow cytometry histogram showing the fluorescence intensity of control DCs (dotted line) and DCs containing phagocytosed CFSE-labeled 45 °C-treated (gray line) or 65 °C-treated EG7 cells (dark line). c Representative confocal images showing CFSE (green)-labeled 65 °C-treated EG7 cells (arrow) phagocytosed into the cytoplasm of PE (red)-labeled CD11c-positive DCs. Scale bar = 20 μm. d Purified DCs were stained with anti-CD80, anti-Iab (solid lines) and isotype control Abs (dotted line) and analyzed by flow cytometry. Mean fluorescence intensity (MFI) numbers are indicated. e Cells in blood samples from mice (4 each group) immunized with DCs that phagocytosed heat-treated EG7 cells were stained with OVA-specific PE-Tetramer and a FITC-labeled anti-CD8 antibody and analyzed by flow cytometry. The gating for OVA-specific CTLs stained with both the FITC-labeled anti-CD8 antibody and PE-tetramer from mice immunized with DCEG7 (45 °C) and DCEG7 (65 °C) was based on the assessment of CTLs in the control PBS-treated mice. A total of 20,000 CD8+ T cells were counted. The value in each panel represents the percentage of OVA-specific CD8+ T cells among the total CD8+ T-cell population. *P < 0.05 versus cohort of DCEG7(45 °C)-activated CD8+ T cells (Student’s t-test). f In vivo cytotoxicity assay. The OVA-specific CFSEhigh (H) and control CFSElow (L) target cells remaining in the spleen of mice (4 each group) immunized with DCEG7(45 °C) and DCEG7(45 °C) were analyzed by flow cytometry. The value in each panel represents the percentage of CFSEhigh target cells remaining in the recipient’s spleen. *P < 0.05 versus the cohort of DCEG7(45 °C)-immunized mice (Student’s t-test). One representative experiment out of two experiments is shown

