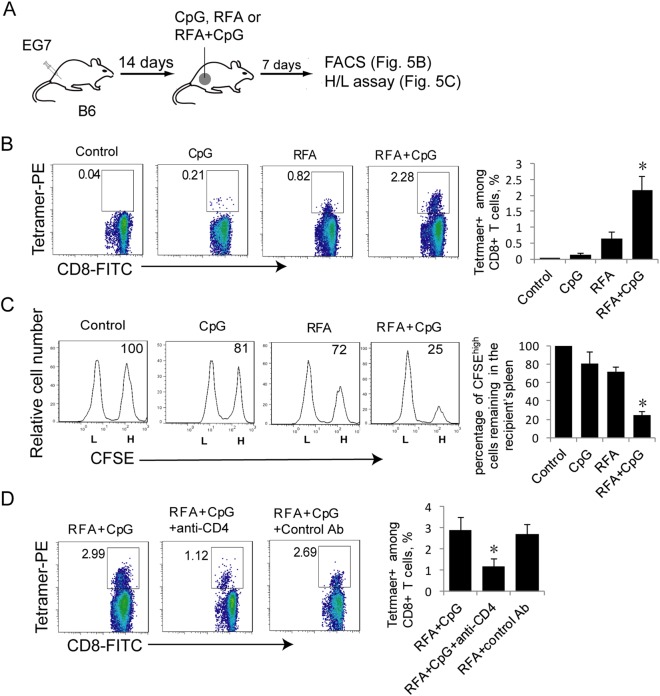
Fig. 5.
CpG administration enhances RFA-induced CTL responses in vivo. a A diagram summarizing the design of RFA treatment experiments. b The cells in mouse blood samples derived from RFA/CpG-, RFA- or CpG-treated EG7 tumor-bearing mice (4 each group) were stained with OVA-specific PE-Tetramer and a FITC-labeled anti-CD8 antibody and analyzed by flow cytometry. The gating for OVA-specific CTLs stained with both the FITC-labeled anti-CD8 antibody and PE-tetramer from tumor-bearing mice treated with RFA, CpG or RFA+CpG was based on the assessment of CTLs in the control PBS-treated mice. A total of 20,000 CD8+ T cells were counted. The value in each panel represents the percentage of OVA-specific CD8+ T cells among the total CD8+ T cell population. *P < 0.05 versus the cohort of RFA-activated CD8+ T cells (Student’s t-test). c In vivo cytotoxicity assay. The OVA-specific CFSEhigh (H) and control CFSElow (L) target cells remaining in the spleen of RFA/CpG- or RFA-treated tumor-bearing mice (4 each group) were analyzed by flow cytometry. The value in each panel represents the percentage of CFSEhigh target cells remaining in the recipient’s spleen. *P < 0.05 versus the cohort of RFA-treated mice (Student’s t-test). d The cells in mouse blood samples derived from RFA/CpG-treated EG7 tumor-bearing mice (4 each group) that underwent CD4+ T-cell depletion were stained with OVA-specific PE-Tetramer and a FITC-labeled anti-CD8 antibody and analyzed by flow cytometry. The gating for OVA-specific CTLs stained with both the FITC-labeled anti-CD8 antibody and PE-tetramer from tumor-bearing mice immunized and treated with RFA and RFA+CpG was based upon the assessment of CTLs in the control PBS-treated mice. A total of 20,000 CD8+ T cells were counted. The value in each panel represents the percentage of OVA-specific CD8+ T cells among the total CD8+ T-cell population. *P < 0.05 versus the cohort of the control antibody-treated mice (Student’s t-test). One representative experiment out of two experiments is shown

