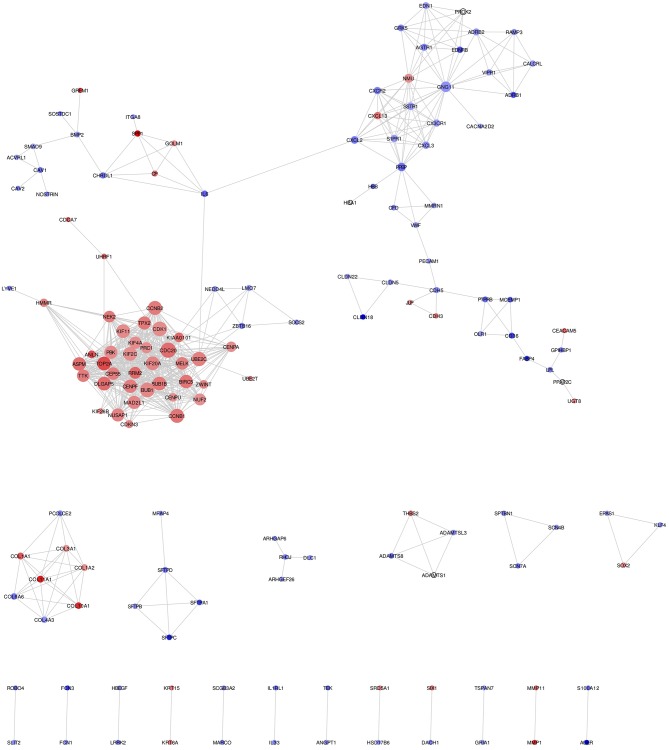
Figure 2.
NSCLC network showing protein-protein integration network in NSCLC. Red node indicates up-regulated; while blue node indicates down-regulated mRNAs in NSCLC compared to normal. Size of the node is based upon degree of connectivity of the node. Edges in the network represent direct interactions between nodes.

