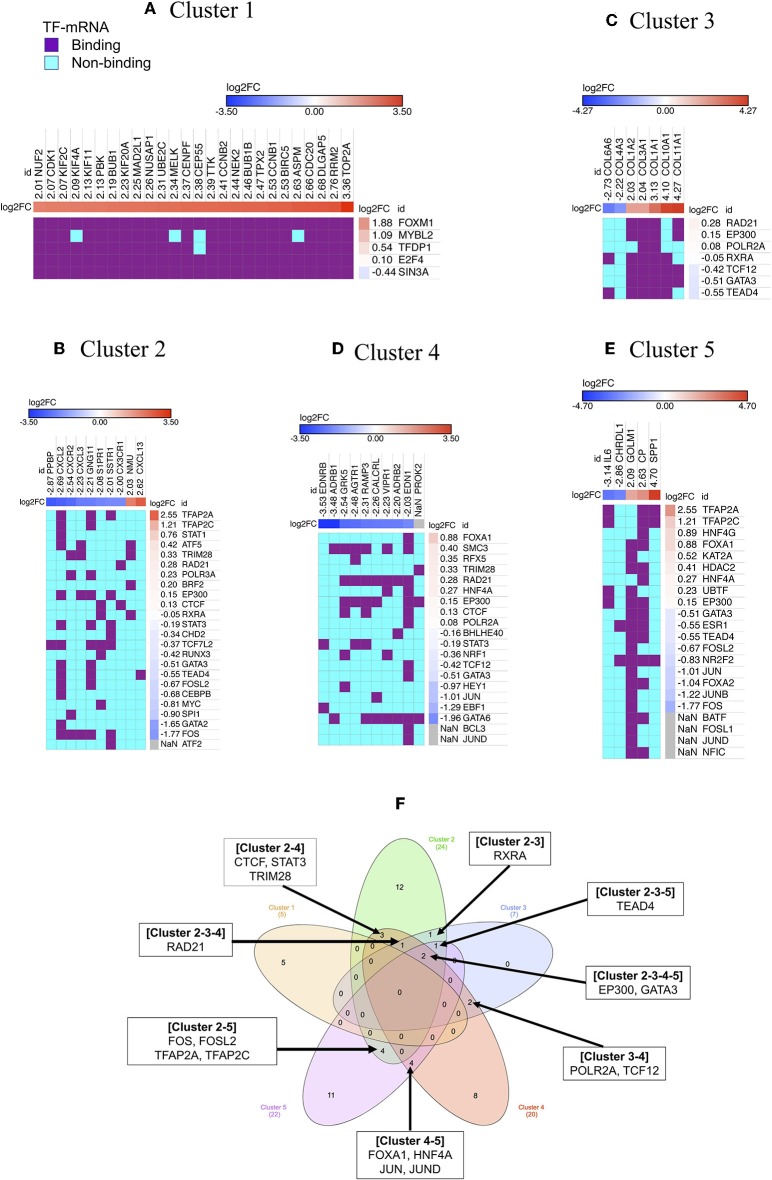
Figure 3.
Regulators of gene cluster 1–5. Each column indicates gene in a cluster, while each row indicates TF identified by iRegulone (A–E). Up-regulated DEGs in the cluster is red with positive log2FC; while down-regulated DEGs is blue with negative log2FC. TF binding with the mRNA is in purple, while non-binding in cyan. “NaN” If the log2FC is not available in our list of DEGs. (F) Venn diagram showing common TFs regulating different clusters.

