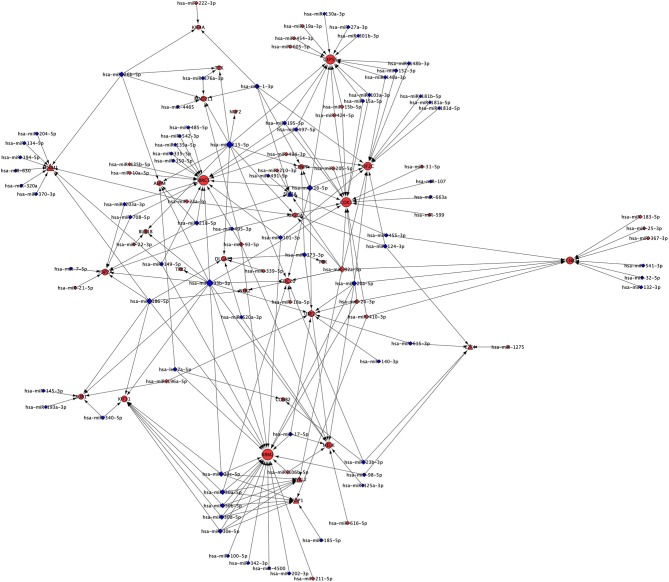
Figure 5.
miRNA network of Cluster 1 showing miRNAs targeting mRNAs and TFs of Cluster 1. Red node indicates up-regulated; while the blue node indicates down-regulated expression in NSCLC compared to normal. Size of the node is based upon degree of connectivity of the node. Nodes shape with triangle, round, and diamond represent TFs, mRNAs, and miRNAs, respectively.

