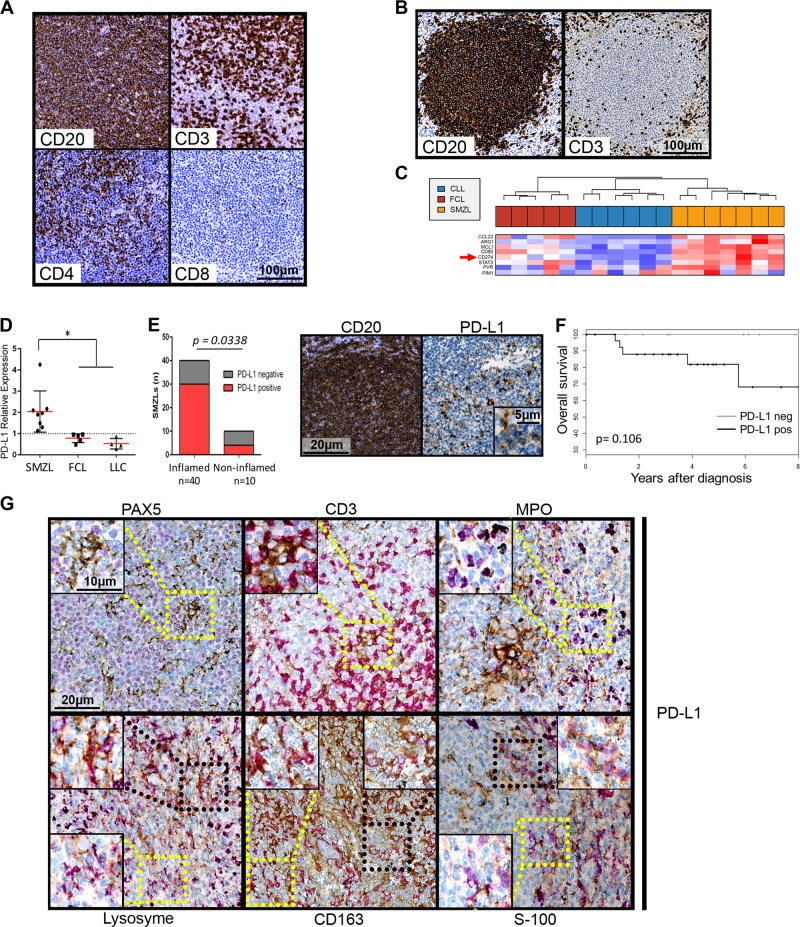
Fig. 1.
a and b: example of CD20, CD3, CD4 and CD8 immunohistochemical labeling of spleen sections from two SMZL patients, one with an inflamed phenotype (a) and one with an immune-excluded (b) phenotype. c Clustering of genes from the immune escape gene signature published by Laurent et al.8 for SMZLs, CLLs and FCLs. Detailed legends are in Supplementary Figure 1. d PD-L1 mRNA expression levels shown according to diagnosis (SMZL, CLL and FCL). RT-QPCR was performed using the TaqMan expression assay Hs00204257_m1 from Applied Biosystems. Normalization was performed on HPRT1 expression (Hs02800695_m1) and on a pool of four normal lymph nodes. Normal lymph node expression, which was arbitrarily set equal to 1, is represented by the dashed horizontal line. The mean and standard deviation are shown for each lymphoma type. PD-L1 expression was significantly increased in the SMZLs compared to the CLLs and FCLs, as shown by * p < 0.05. e Left panel: histogram representation of the PD-L1 expression in inflamed or uninflamed SMZL tumors. Right panel: example of immunohistochemical PDL-1 labeling compared to CD20 staining of the same sample. f Overall survival of SMZL patients according to PD-L1 expression. g Example of immunohistochemical double staining for PDL-L1 (in brown) and either Pax5, CD3, myeloperoxidase (MPO), lysozyme, CD163 or S-100 protein. MPO, Lysozyme, CD163 and S-100 protein labeling is shown in purple. Selected microphotographs display the border of a nodule with CD163, lysozyme and S-100 protein labeling to show double-positive cells in the nodule and single-positive cells outside the nodule. Magnified images for PD-L1-negative (yellow square) or PD-L1 double-positive cells (black square) are shown as insets. In this study, 64 SMZL, 5 FCL, and 6 CLL patients were enrolled according to institutional regulations and after approval by the Scientific and Methodological board of the university hospital of Limoges. A tissue microarray (TMA) was performed with formalin-fixed, paraffin-embedded (FFPE) tumor samples from 54 patients. Tissue cores with a 1 mm diameter were arrayed on a recipient paraffin block using a tissue arrayer (Beecher Instruments Tissue Arrayeur, New Jersey, USA). Each tumor sample was punched in triplicate. TMA blocks were sliced at 4 mm. Antibodies against CD20 (clone L26), CD3 (clone 2GV6), Pax5 (clone SP34) and myeloperoxidase (polyclonal immune serum) were purchased from Roche Diagnostics (Meylan, France); those against CD8 (clone C8/144B) and protein S-100 (polyclonal immune serum) were obtained from Dako (Glostrup, Denmark); and those against CD4 (clone 4B12) and CD163 (clone 10D16) were purchased from Novocastra (Leica Biosystems, Wetzlar, Germany). Immunohistochemistry was carried out on a Benchmark®ULTRA (ROCHE -VENTANA) with an UltraView Universal DAB (760–500) detection kit, and the sections were counterstained with hematein eosin. For PD-L1, immunohistochemistry was carried out on Benchmark®ULTRA (ROCHE -VENTANA) with an OptiView DAB IHC (760–700) detection kit for PD-L1 for simple staining (clone SP263; Roche Diagnostics), with a double-staining oDAB-uRed kit (Roche Diagnostics) for double labeling of PD-L1 with CD163, CD3 or Pax5 and with a RUO Discovery Universal DAB-purple kit (Roche Diagnostics) for double labeling of PD-L1 with MPO, lysozyme or protein S-100. The microarray slides were scanned with a Hamamatsu Photonics K. K slide scanner (Hamamatsu Photonics K. K, Hamamatsu City, Japan). Images were visualized with NDP software from Hamamatsu Photonics K.K. Staining for T-cells was scored semiquantitatively as “present (2 + ),” “rare (1 + ),” or “absent (0)”, as previously described.15 For PD-L1, cases were positive when more than 5% of the intratumoral cells were positive

