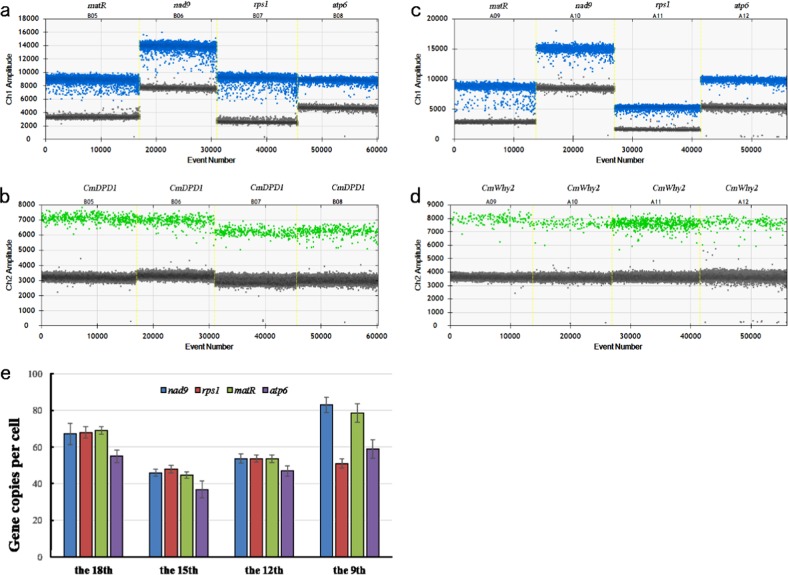
Fig. 2. Copy numbers of mitochondrial genes per cell at the four stages of melon leaf development.
a and c, Clusters showing the droplet distribution after amplification of melon leaf total DNA templates at the 18th-leaf stage with specific primers and probes; intensity collected via QX200 filters suited for FAM (Ch1). Left to right: clusters showing the droplet distribution after amplification with specific probes for detecting the mitochondrial genes matR, nad9, rps1, and atp6, respectively. b and d, Clusters showing the droplet distribution after amplification of melon leaf total DNA templates at the 18th-leaf stage with the specific primers and probes; intensity collected via QX200 filters suited for HEX (Ch2). Left to right: clusters showing droplet distribution after amplification with probes for detecting the nuclear gene CmDPD1. The mitochondrial and nuclear genes detected by hydrolysis probes with different fluorophores occurred in the same reaction. e, The absolute copy number of four mitochondrial genes (nad9, rps1, matR, and atp6); the nuclear-encoded single-copy genes CmDPD1 and CmWhy2 were used as internal standards. The per-cell copy numbers of mitochondrial genes were calculated with the absolute copy number and the mean C levels

