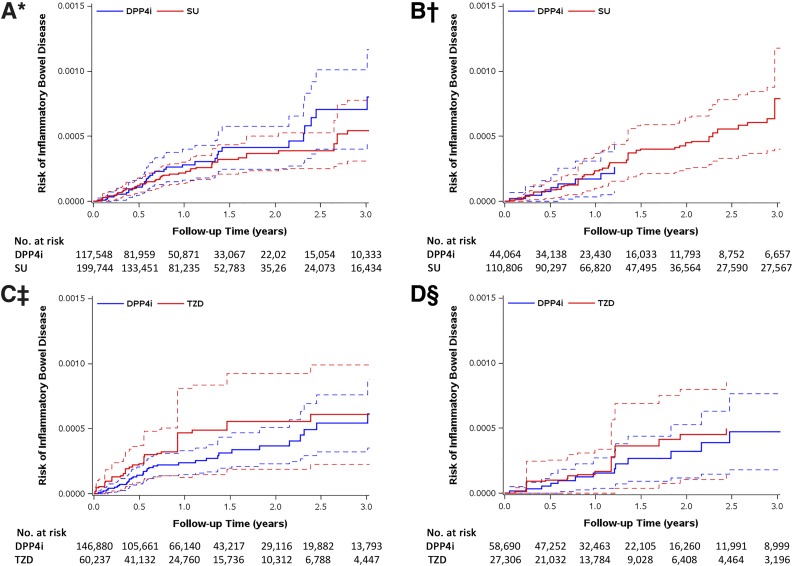
Figure 1.
SMR-weighted Kaplan-Meier plots of IBD: DPP4i vs. SU cohort in MarketScan (A), DPP4i vs. SU cohort in Medicare (B), DPP4i vs. TZD cohort in MarketScan (C), and DPP4i vs. TZD cohort in Medicare (D). Follow-up started for the outcome 180 days (induction period) after the second prescription (cohort entry date). SMR weights create a pseudopopulation of the untreated (comparators: SU or TZD), which has the same covariate distribution as the treated (DPP4i). Every patient receiving DPP4i has a weight of 1, while every patient in the comparator group is weighted by (PS/[1 − PS]). The risks on the y-axis were obtained by SMR-weighted Cox model (weighting comparator drug initiators by the PS odds [PS/(1 − PS)]). HR treating comparators as reference; aHR <1 indicates a lower risk for DPP4i. Dotted lines around the survival curve point estimates represent 95% CI bands. *HR 1.08 (95% CI 0.70–1.68); †HR 0.53 (0.24–1.15); ‡HR 0.68 (0.37–1.26); §HR 0.97 (0.40–2.37).

