Figure 5.
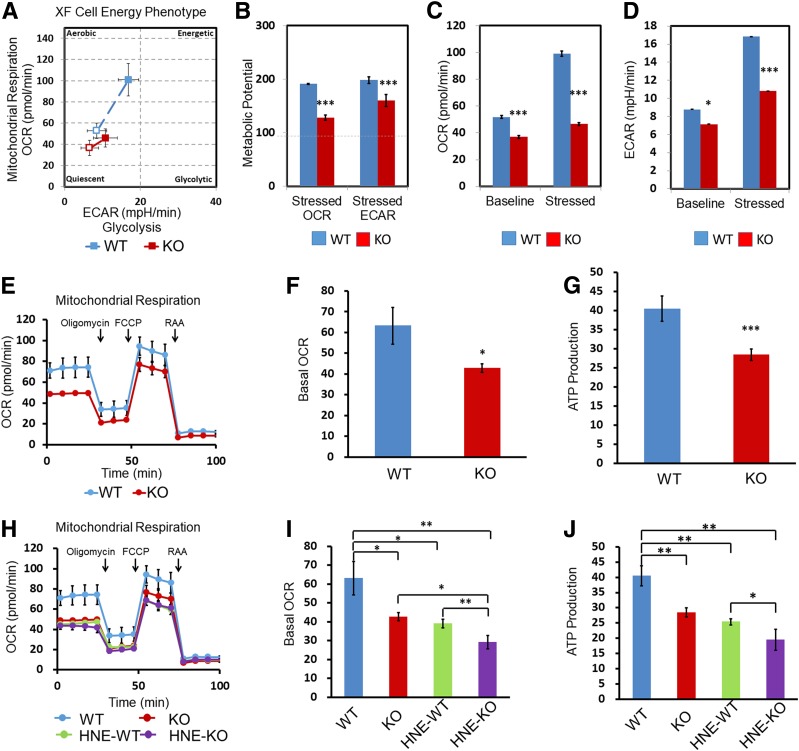
PPARα KO decreased ECFC mitochondrial oxidation. A: ECFC energy profile was measured and compared between WT ECFCs (WT) and PPARα−/− ECFCs (KO); the open square (□) represents baseline metabolism, and filled square (▪) represents stressed/maximal metabolism. The distance between the baseline and maximal metabolism represents metabolic potential (B), baseline and stressed OCR (C), and baseline and stressed ECAR (D). E and H: Representative traces of OCR of WT and KO ECFCs with and without HNE treatment (10 μmol/L, 24 h). The injections of reagents [oligomycin, carbonyl cyanide-4 (trifluoromethoxy)phenylhydrazone (FCCP), and rotenone and antimycin A (RAA)] during the Seahorse analysis are indicated by arrows. Basal OCR (F and I) and ATP production (G and J) (the basal respiration that potentially supports ATP production) were calculated and compared. All values are mean ± SEM; n ≥ 3, *P < 0.05; **P < 0.01; ***P < 0.001. mpH, milli pH units.

