Figure 7.
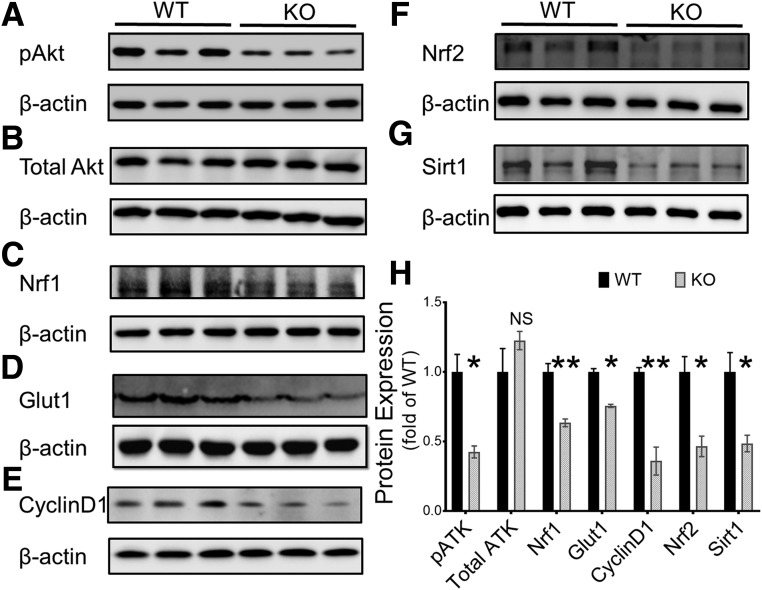
PPARα KO decreased Akt activation in ECFCs. A–G: Western blot analysis of phosphorylated Akt (pAkt), total Akt, Nrf1, Glut1, cyclin D1, Nrf2, and Sirt1 in primary ECFCs from PPARα−/− (KO) and WT mice; β-actin was used as loading control. H: Densitometry analysis of protein levels in the Western blots (mean ± SEM; n = 3; *P < 0.05; **P < 0.01).

