Figure 4.
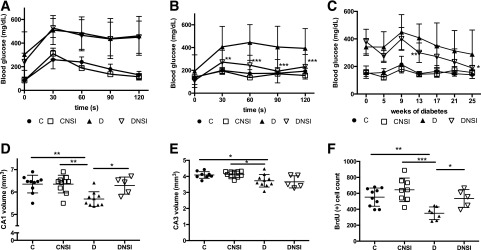
Oral glucose tolerance test in db/db mice after 8 weeks of diabetes (A) and after 25 weeks of diabetes and treatment (B). C: Blood glucose levels for db/db mice with NSI-189 treatment starting at onset of diabetes. CA1 (D) and CA3 (E) volume and BrdU-positive cells (F) counted in the hippocampus after 26 weeks of diabetes and treatment. C, control mice treated daily with vehicle; CNSI, control mice treated daily with NSI-189; D, db/db mice treated daily with vehicle; DNSI, db/db mice treated daily with oral NSI-189. Data are mean ± SD. *P < 0.05, **P < 0.01, ***P < 0.001 against db/db + vehicle by repeated-measures ANOVA, followed by the Dunnett post hoc test, for panels A–C (n = 8–10/group). *P < 0.05, **P < 0.01, ***P < 0.001 by one-way ANOVA, followed by the Dunnett post hoc test, for panels D–F (n = 5–10/group).

