Figure 6.
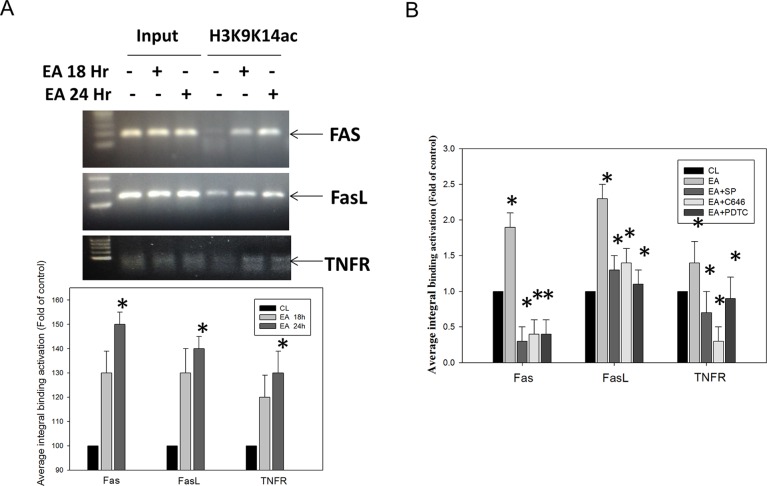
Effect of the kinase inhibitors in blocking the binding activities of the Fas, FasL, and TNFR promoter regions, as induced by erinacine A stimulation. (A) Next, the chromatin immunoprecipitation (ChIP) assays were performed using antibodies against histone H3K9K14ac (Acetyl Lys9/Lys14), in order to pull down associated DNA. The precipitated DNA was amplified by PCR using primer sets specific to the target sites of Fas, FasL, and TNFR promoters. DNA pulled down by the anti-IgG antibody served to identify the background amplification. Input DNA was amplified as a loading control. The recovered DNA is amplified by quantitative real-time PCR (qRT-PCR), which used specific primers on the sequence of interest to detect the bound DNA in electrophoresis. The CT values, as generated in triplicate technical repeats, are similar, and the quantitative data are presented as the mean of three repeats of one independent experiment. (B) DLD-1 cells were incubated with or without various concentrations of the specific JNK1/2 inhibitor SP600125, NFκB inhibitor PDTC, or the p300-Binding Protein inhibitor C646 for 24 h. The data are presented as the mean ± SD of three independent experiments. *P < 0.05, as compared to the control group.

