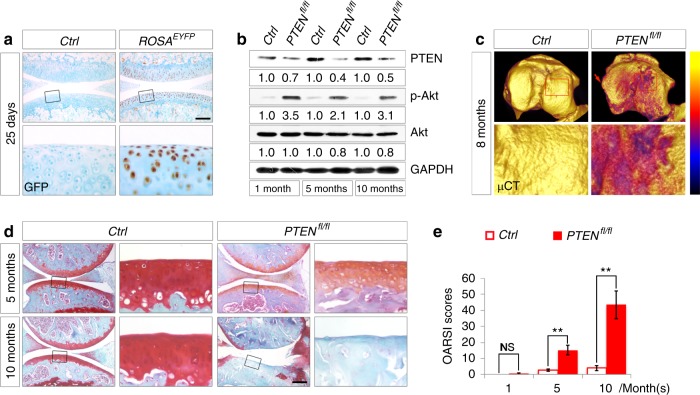
Fig. 2.
PTEN deficiency in articular chondrocytes causes OA in mice. a Representative images of immunohistochemical staining of EYFP in sagittal sections of 25-day-old Ctrl and ROSAEYFP knee joints (n = 2 per group). The framed area in each picture is shown below at a higher magnification. b Western blot analyses for the levels of PTEN, Akt, and p-Akt in articular cartilage from Ctrl and PTENfl/fl mice at 1, 5, and 10 months. Quantitative densitometry results are shown below. The GAPDH protein serves as an endogenous normalizer. c Representative color-coded 3D-reconstructed μCT images of the tibial plateau from Ctrl and PTENfl/fl mice at 8 months (n = 3 per group). A color scale bar ranging from yellow to black is shown to indicate respective HU values from low to high. The arrow denotes an osteophyte at the medial tibial plateau. The framed area in each picture is shown below at a higher magnification. d Representative images of safranin O staining of Ctrl and PTENfl/fl knee joints at 5 and 10 months (n = 8 per group). The framed area in each picture is shown on the right at a higher magnification. e Quantified pathological changes of Ctrl and PTENfl/fl knee joints at 1, 5, and 10 months. Each value represents the mean ± SEM (n = 8 per group). NS: not significant; **P < 0.01. Scale bars: 200 µm in (a); 250 µm in (d)

