Fig. 5.
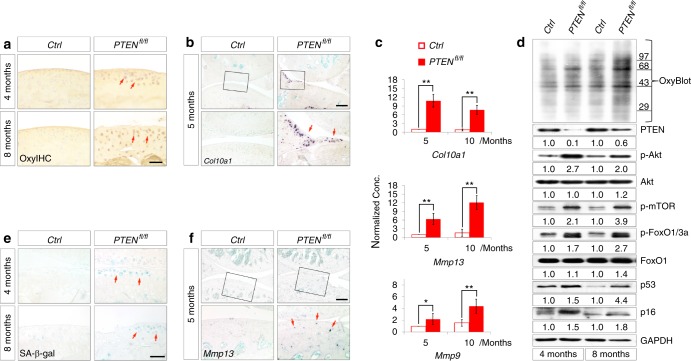
Sustained Akt signaling in articular chondrocytes causes oxidative stress-related senescence. a Representative images of OxyIHC staining of articular cartilage from Ctrl and PTENfl/fl mice at 4 and 8 months (n = 4 per group). Red arrows denote the positive staining within articular chondrocytes of PTENfl/fl mice. b Representative images of Col10a1 in situ hybridization analyses of knee joints from Ctrl and PTENfl/fl mice at 5 months (n = 3 per group). The framed area in each picture is shown below at a higher magnification. Red arrows denote the positively stained cells within the articular cartilage and meniscus of PTENfl/fl mice. c Representative real-time PCR analyses of Col10a1, Mmp13, and Mmp9 expression in articular cartilage from Ctrl and PTENfl/fl mice at 5 and 10 months. Each value represents the mean ± SEM (n = 3 per group). *P < 0.05; **P < 0.01. d OxyBlot analysis for protein oxidation and western blot analyses for the levels of molecules involved in PTEN/Akt senescence axis. Samples were collected from articular cartilage of Ctrl and PTENfl/fl mice at 4 and 8 months. Quantitative densitometry results are shown below. The GAPDH protein serves as an endogenous normalizer. e Representative images of SA-β-gal staining of articular cartilage from Ctrl and PTENfl/fl mice at 4 and 8 months (n = 4 per group). Red arrows denote the senescent articular chondrocytes in PTENfl/fl mice. f Representative images of Mmp13 in situ hybridization analysis of knee joints from Ctrl and PTENfl/fl mice at 5 months (n = 3 per group). The framed area in each picture is shown below at a higher magnification. Red arrows denote the positively stained cells within the articular cartilage of PTENfl/fl mice. Scale bars: 50 µm in (a) and (e), 250 µm in (b) and (f)

