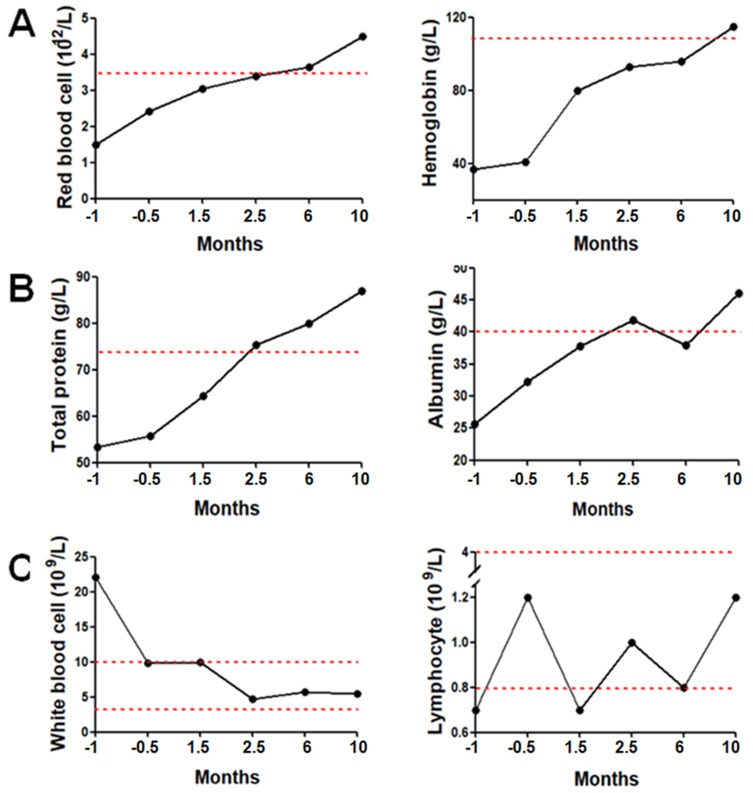
Figure 1.
Blood parameters before and after hydrogen treatment. (A) Red blood cell counts and hemoglobin levels; the red line in the represents the lower limit of the reference range. (B) Total protein and albumin concentrations; the red lines in the figures represent the lower limit of the reference range. (C) White blood cell and lymphocyte counts; the red lines in the figures represent the reference range.

