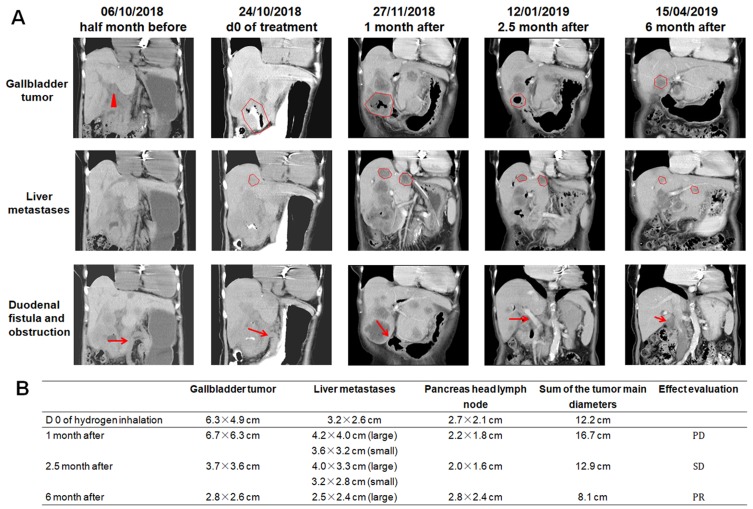
Figure 3.
(A) CT imaging findings at different time-points before and after hydrogen treatment. In the first line of figures, the triangle and the contour lines represent the location and range of the gallbladder. In the second line of figures, the contour lines represent the location and range of the liver metastases. In the third line of figures, the arrows represent the location of the duodenal fistula or obstruction. (B) Evaluation of the effect of hydrogen treatment at different time-points according to CT imaging and RECIST 1.1.
Abbreviations: PD, progressed disease; SD, stable disease; PR, partial remission; CT, computed tomography.

