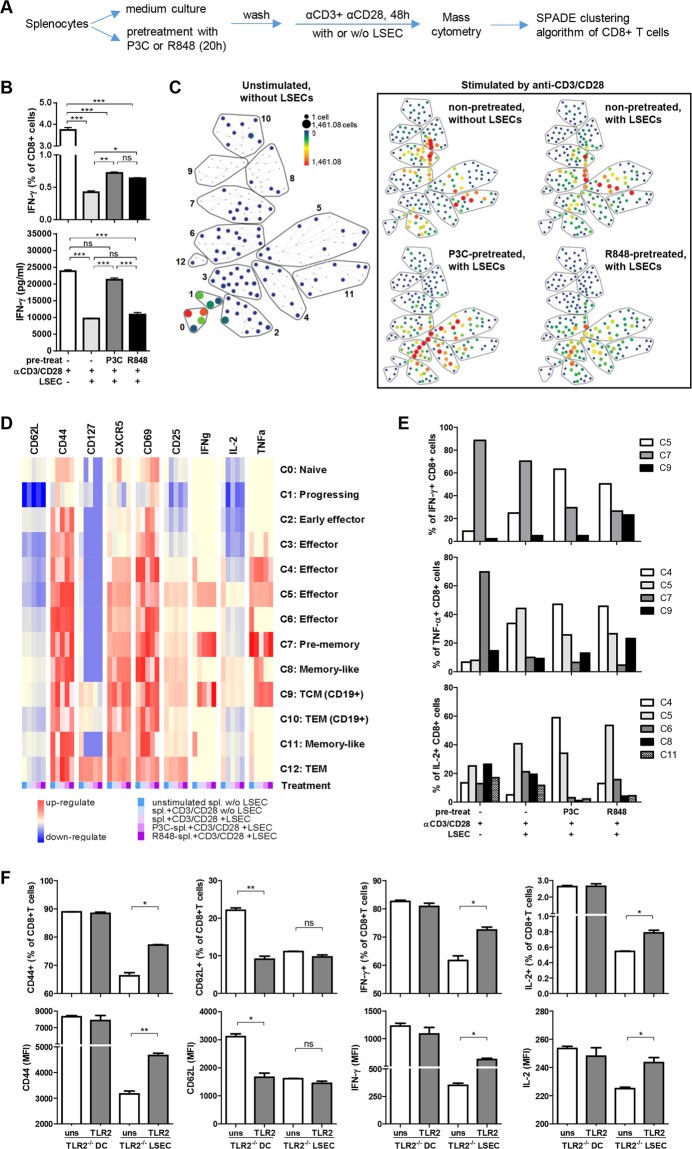
Fig. 1.
Activation of TLRs in CD8+ T cells improves resistance to LSEC-induced tolerance. a Experimental design of T cell pretreatment, coculture and analysis. Splenocytes derived from naïve C57BL/6 mice were prestimulated with P3C (2.5 µg/ml) or R848 (10 µg/ml) for 24 h, washed with 50 ml of PBS 3 times, and then cocultured with LSECs from naïve C57BL/6 mice for an additional 48 h in the presence of anti-CD3 and anti-CD28 antibodies (1 µg/ml). b The frequency of IFN-γ+ CD8+ T cells was analyzed by flow cytometry. Secreted IFN-γ in the supernatants was detected by ELISA (in triplicate, n = 3). c Cells from each group were harvested and pooled for mass cytometry staining and measured with a Helios instrument. The SPADE algorithm was performed on gated CD45+ CD11b− CD3+ NK1.1− CD8+ live single cells to generate the immune landscape for each sample using the surface antigens CD3, CD4, CD8, CD19, CD62L, CD44, CD25, CD127, and CD69 and functional markers IL-2, IL-4, IL-5, IL-6, IL-17a, TNF-α, IFN-γ, and CXCR5. The color gradient and node size indicate cell counts. CD8+ T cells were annotated into 13 major cell populations. d The expression of CD62L, CD44, CD127, CD69, CD25, CXCR5, TNF-α, IFN-γ, and IL-2 is indicated by the mean value in the heatmap of each population. e The number of IFN-γ+, TNF-α+, or IL-2+ cells in each population was counted, and the composition of cytokine-producing cells in each treatment was calculated by count(cytokine+ cells in each population)/count(total cytokine+ cells) × 100%. f To analyze antigen-specific T cell activation, FV-TCR CD8+ T cells were activated by peptide-loaded DCs or LSECs from TLR2−/− mice with or without P3C costimulation (in triplicate, n = 3). The frequency of CD44+, CD62L+, IFN-γ+, or IL-2+ CD8 T cells and MFI of CD44, CD62L, IFN-γ, or IL-2 in CD8+ T cells were analyzed by flow cytometry. The experiments were repeated at least 3 times (b, f). Significant differences are indicated by *(p < 0.05), **(p < 0.01), and ***(p < 0.001)

