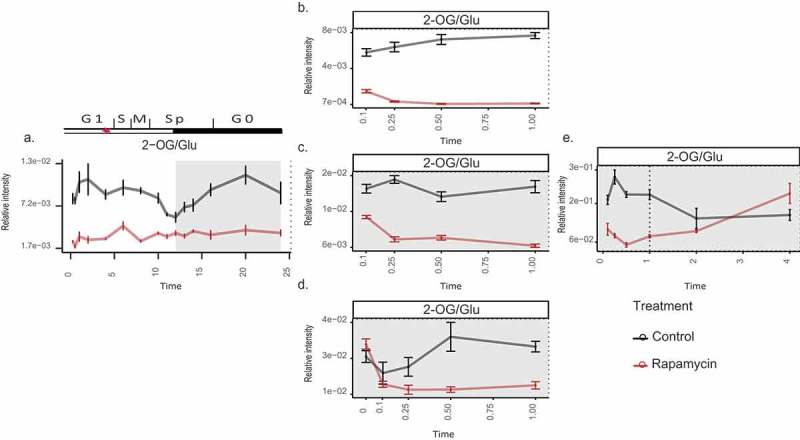
Figure 1.

Changes in the C to N ratio (derived from 2-OG/Glu) upon TOR inhibition in Chlamydomonas.
(a) Over 24-h cell cycle (the red-star symbol in the plot marks the commitment point (CP) of the cell cycle, where the cells grow large enough to commit to divide); (b) in the presence of light (batch culture); (c) dark; (d) dark and no nitrogen; and (e) extended darkness (dotted line indicates the start of extended dark phase). Sampling time is given on the x-axes, while relative intensities are given on the y-axes. Note that 0 h sampling was carried out only in (d) to account for the error introduced due to the nitrogen starvation, before applying rapamycin treatment.11 The metabolites were measured using GC-MS platform. Samples are represented as the mean of six replicates ± SE (a) and five replicates ± SE (b–e). Significance testing was performed by ANOVA2. The data plotted in (a–d) were retrieved from previously published works.11
