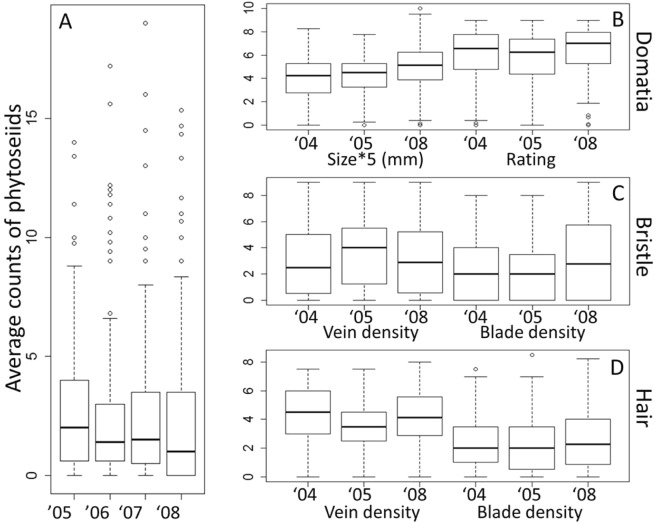
Fig. 3.
Phenotype distributions (box and whiskers plots). a Predatory mite abundance (mean phytoseiid count per leaf), b domatia size and rating, c bristle density in veins and blades, and d hair density in veins and blades, by year. Domatia size is shown as 5X mm measures to fit the plot scale. Bristle and hair density for both veins and blades were determined using a rating system from 0 (absent) to 9 (very dense). Domatia ratings correspond to the average bristle density rating of four domatia per leaf. For each data set, the box indicates the range between 25 and 75%, and middle band indicates the sample median. Outlier values are indicated with a circle

